
ROI Example, Created in Excel
EXAMPLE 1:
EXAMPLE 2:

EXAMPLE 3:
This dashboard gives stakeholders a view of the product application journey. One glimpse quickly tells the overall story, while also showing which months have higher and lower submissions and approvals.
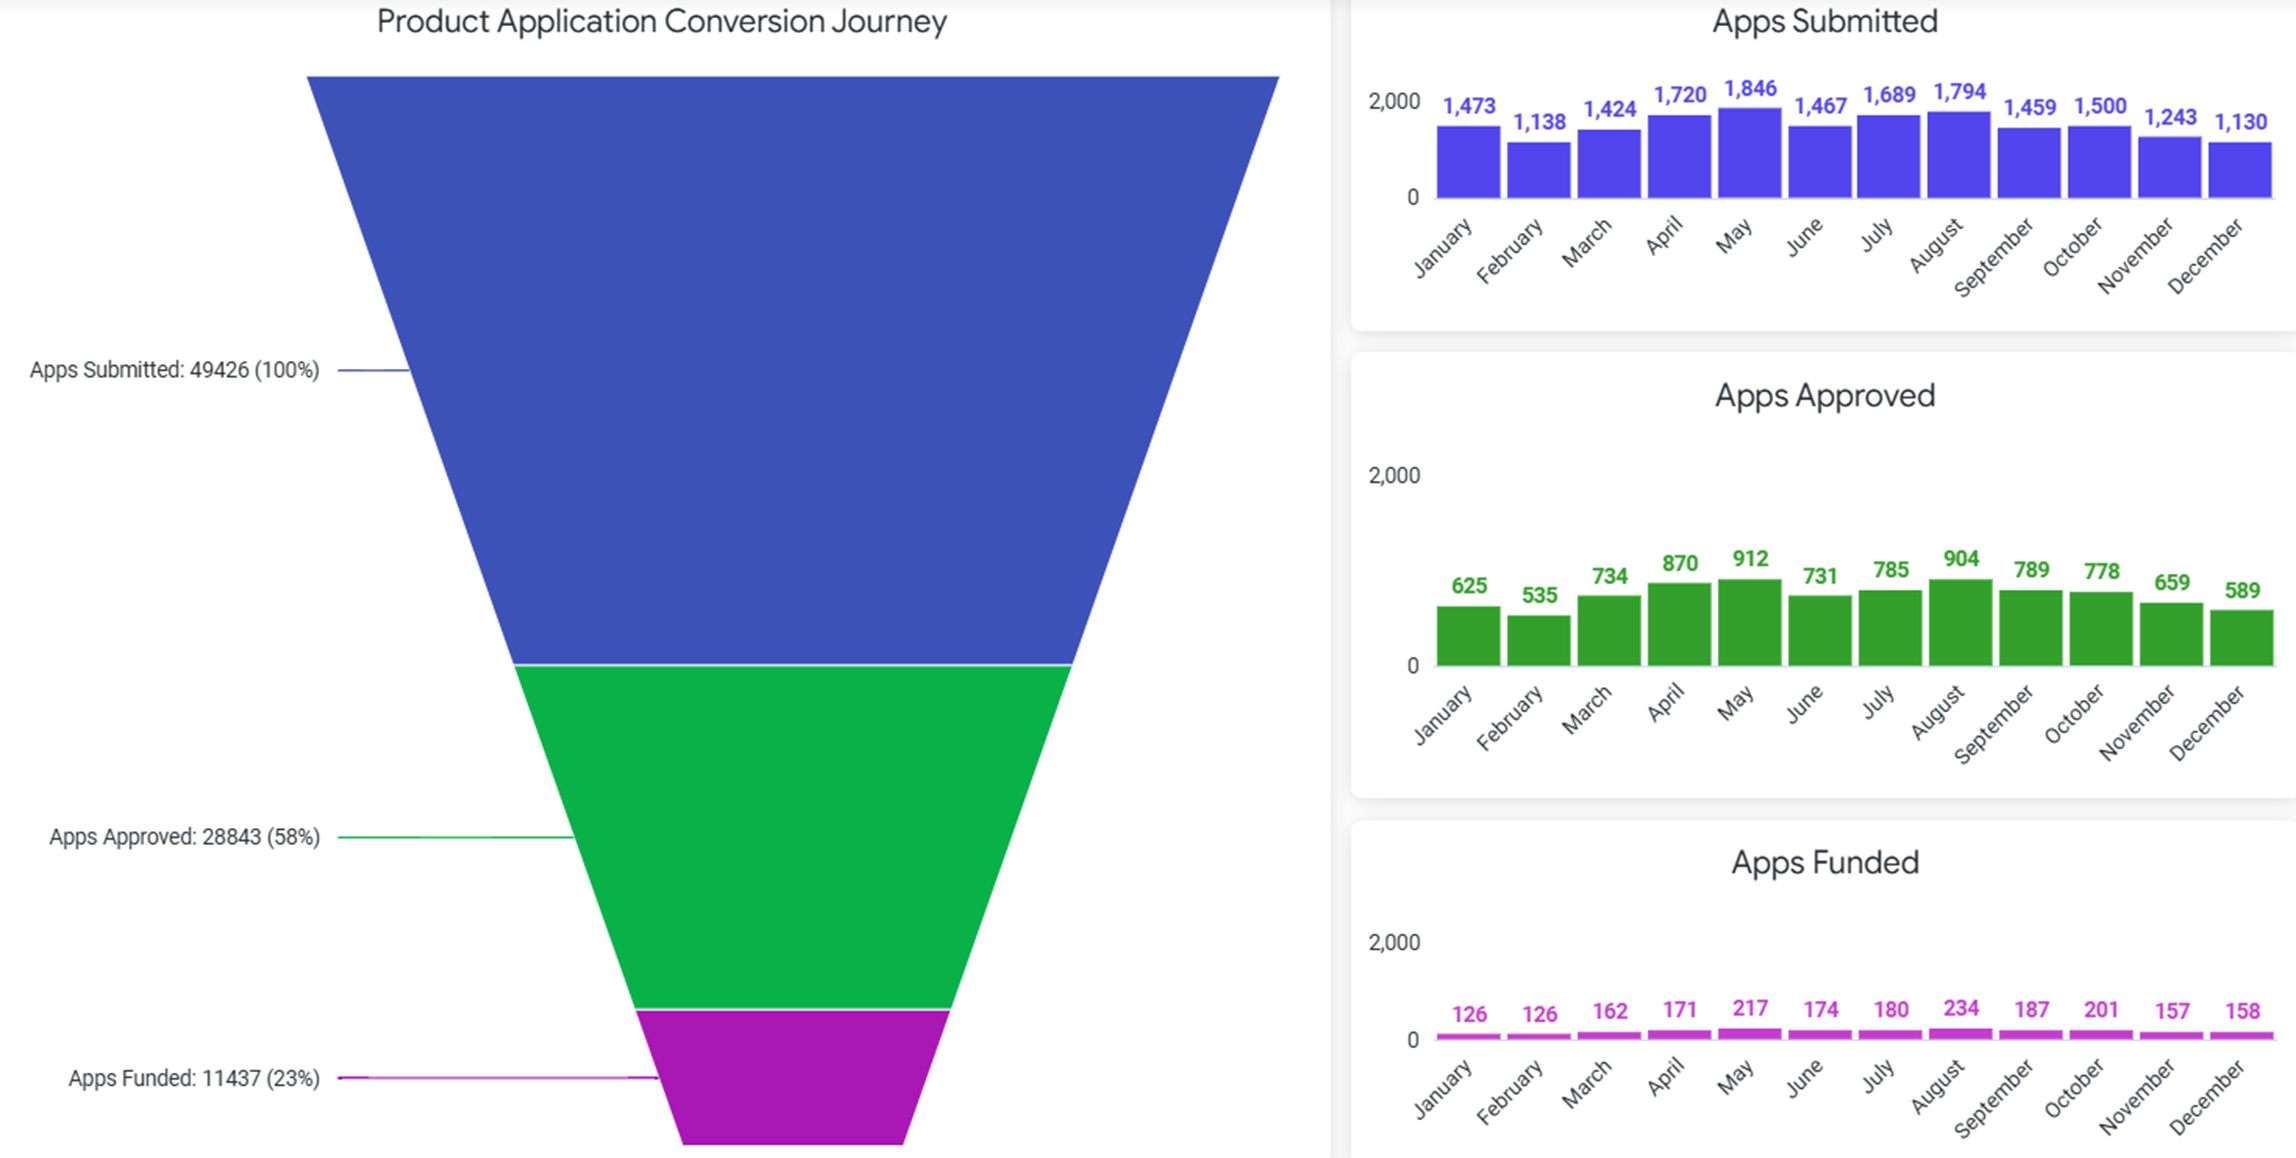
Please note: None of the data in this portfolio is real. It has been fabricated for the purpose of visualization.
This dashboard gives a view of which marketing sources are bringing product applications. Stakeholders can easily see which months fluctuate by source, as well as which sources bring higher or lower quality applications.
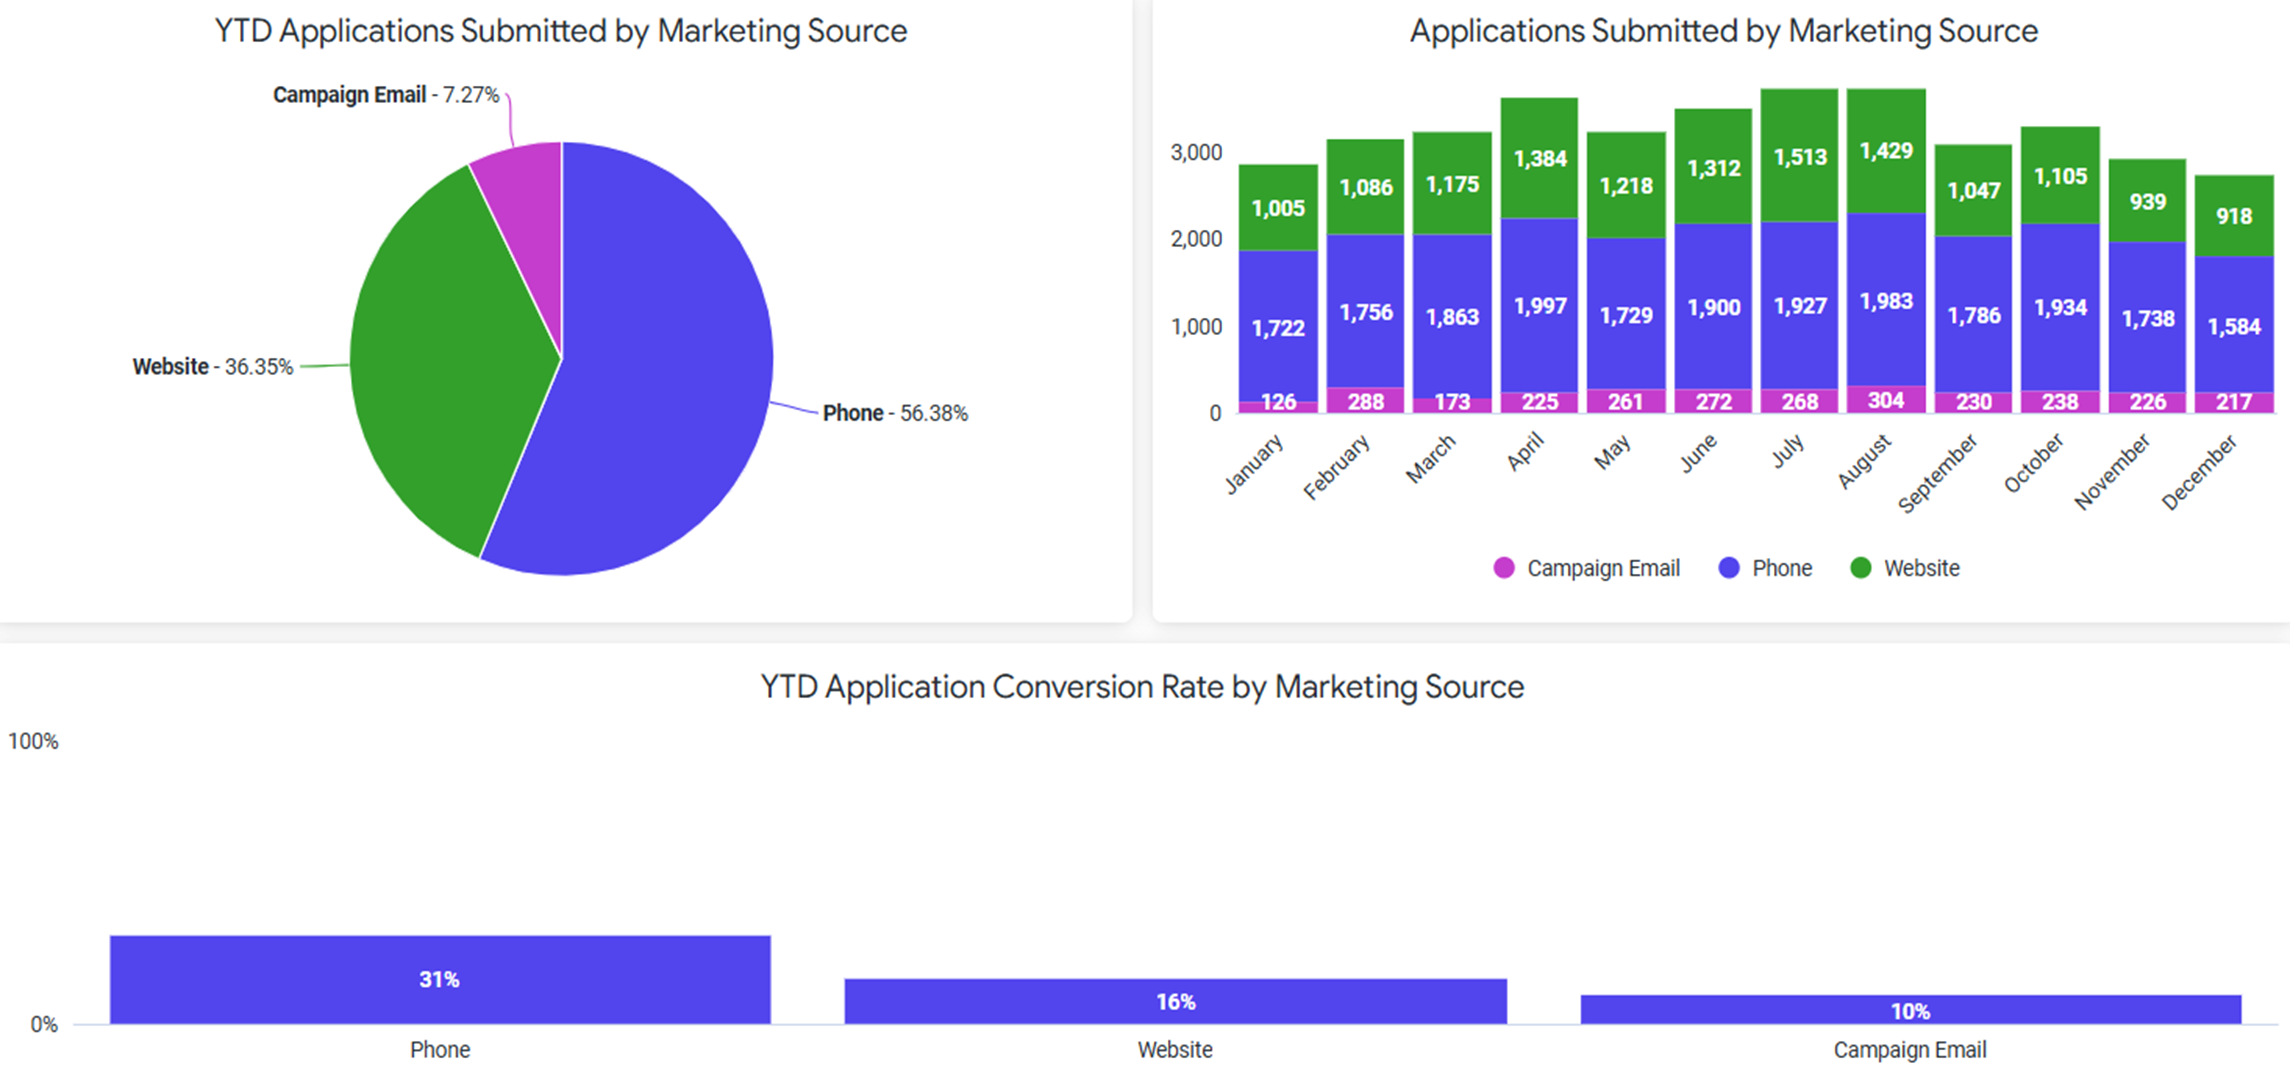
Please note: None of the data in this portfolio is real. It has been fabricated for the purpose of visualization.
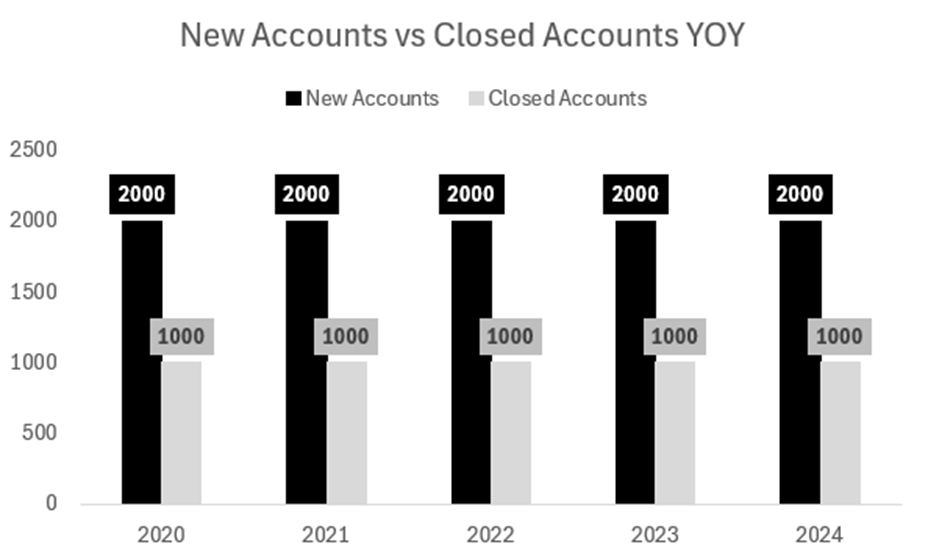
This dashboard gives stakeholders a high-level view of product performance, easily indicating whether goals have been met.
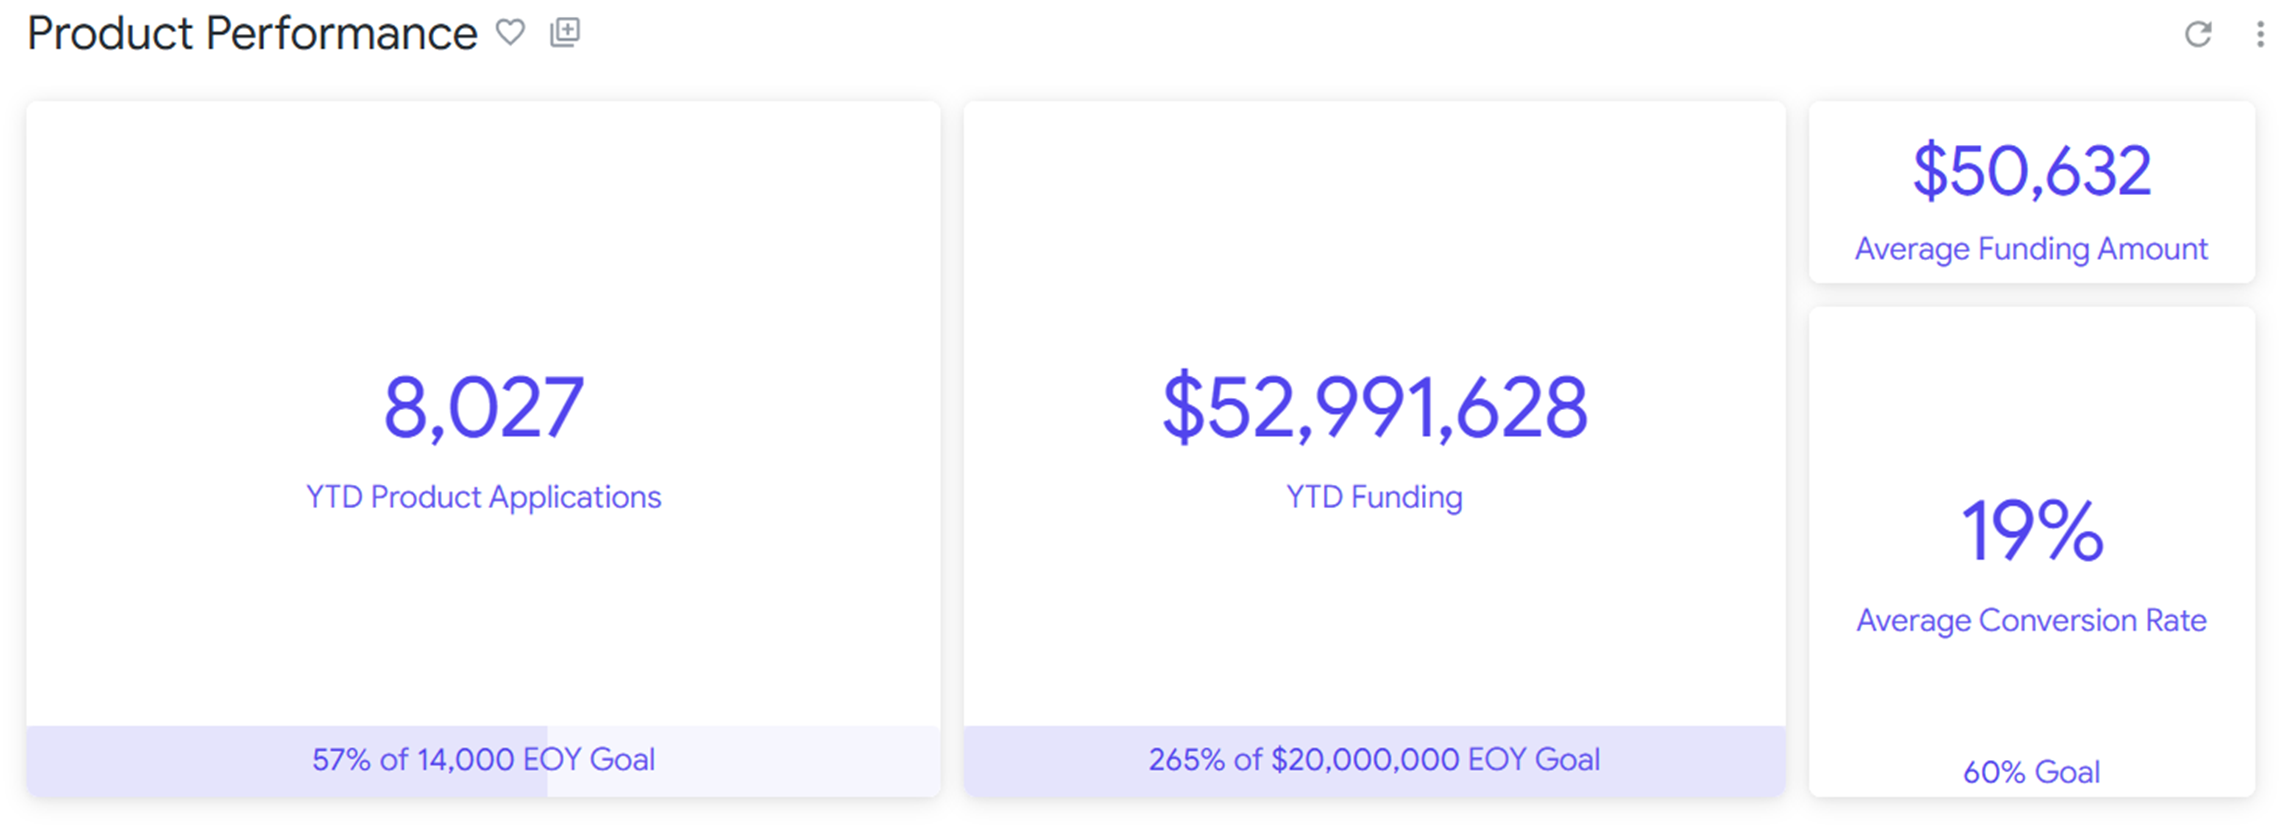
Please note: None of the data in this portfolio is real. It has been fabricated for the purpose of visualization.
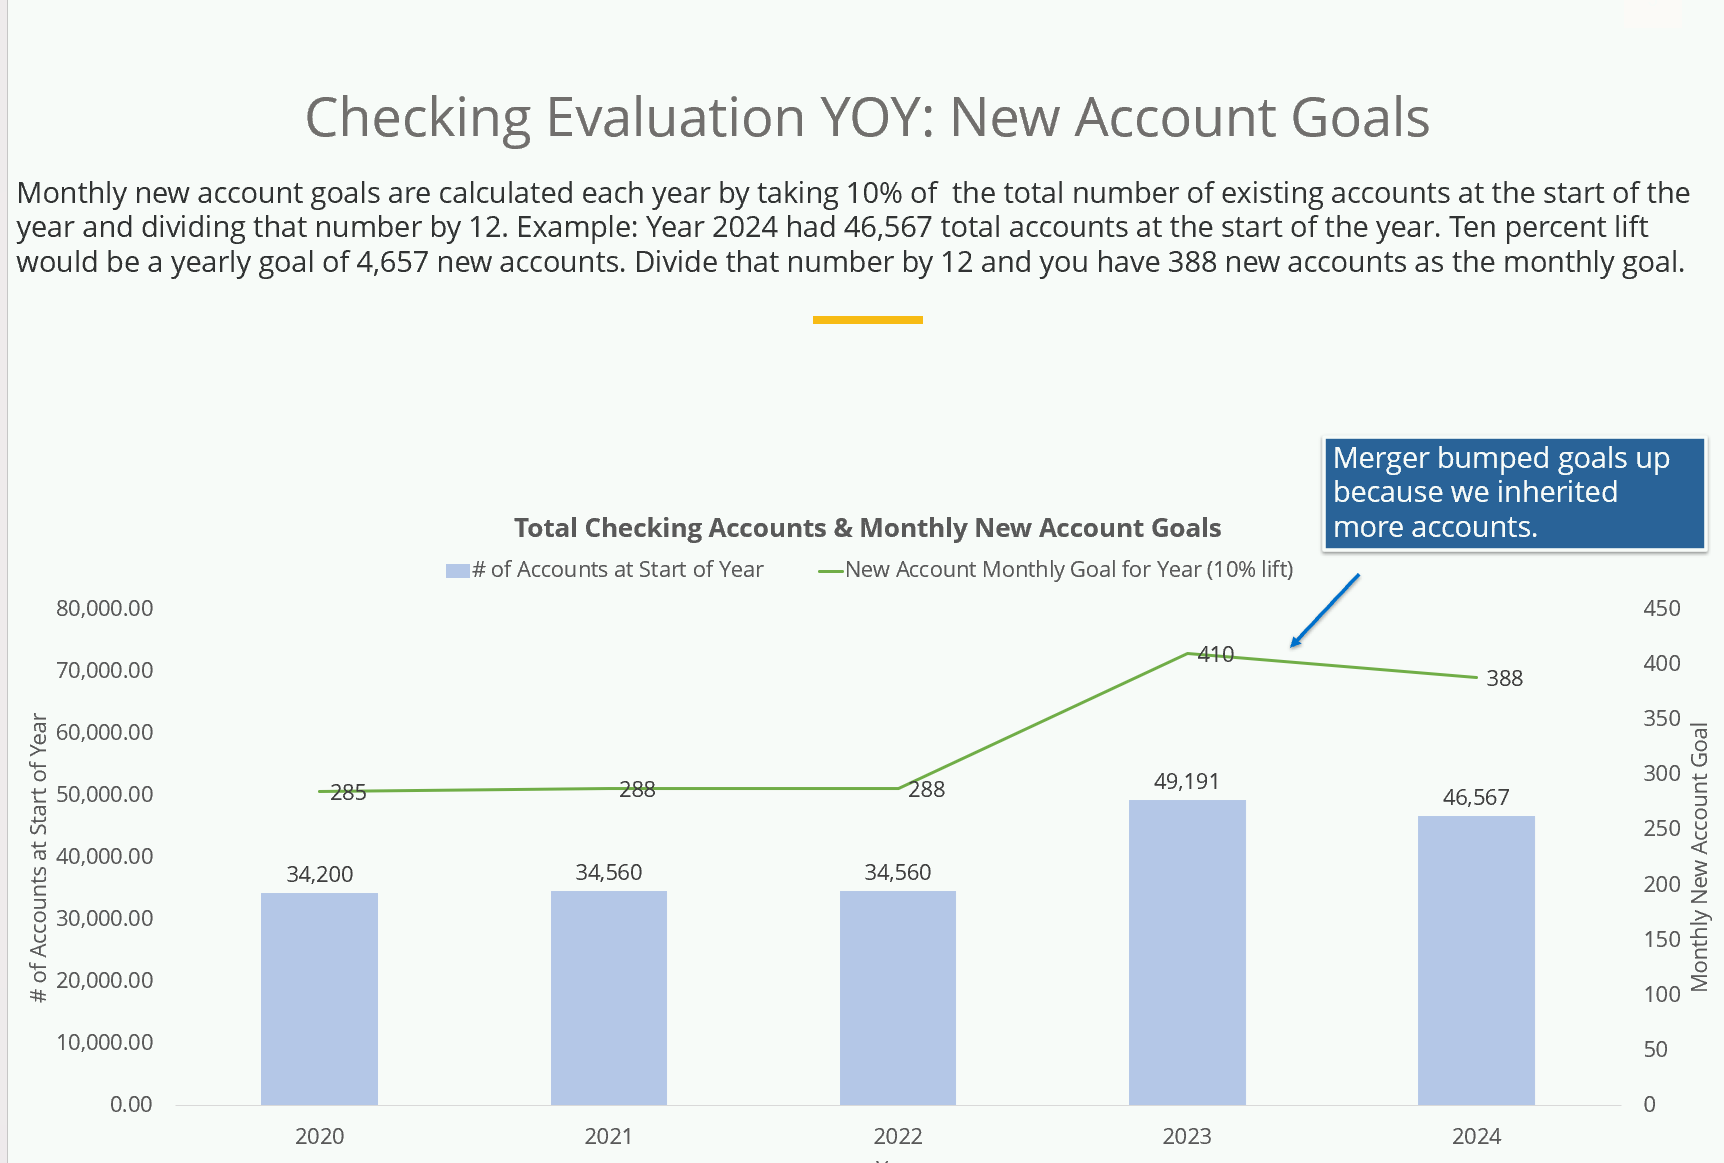
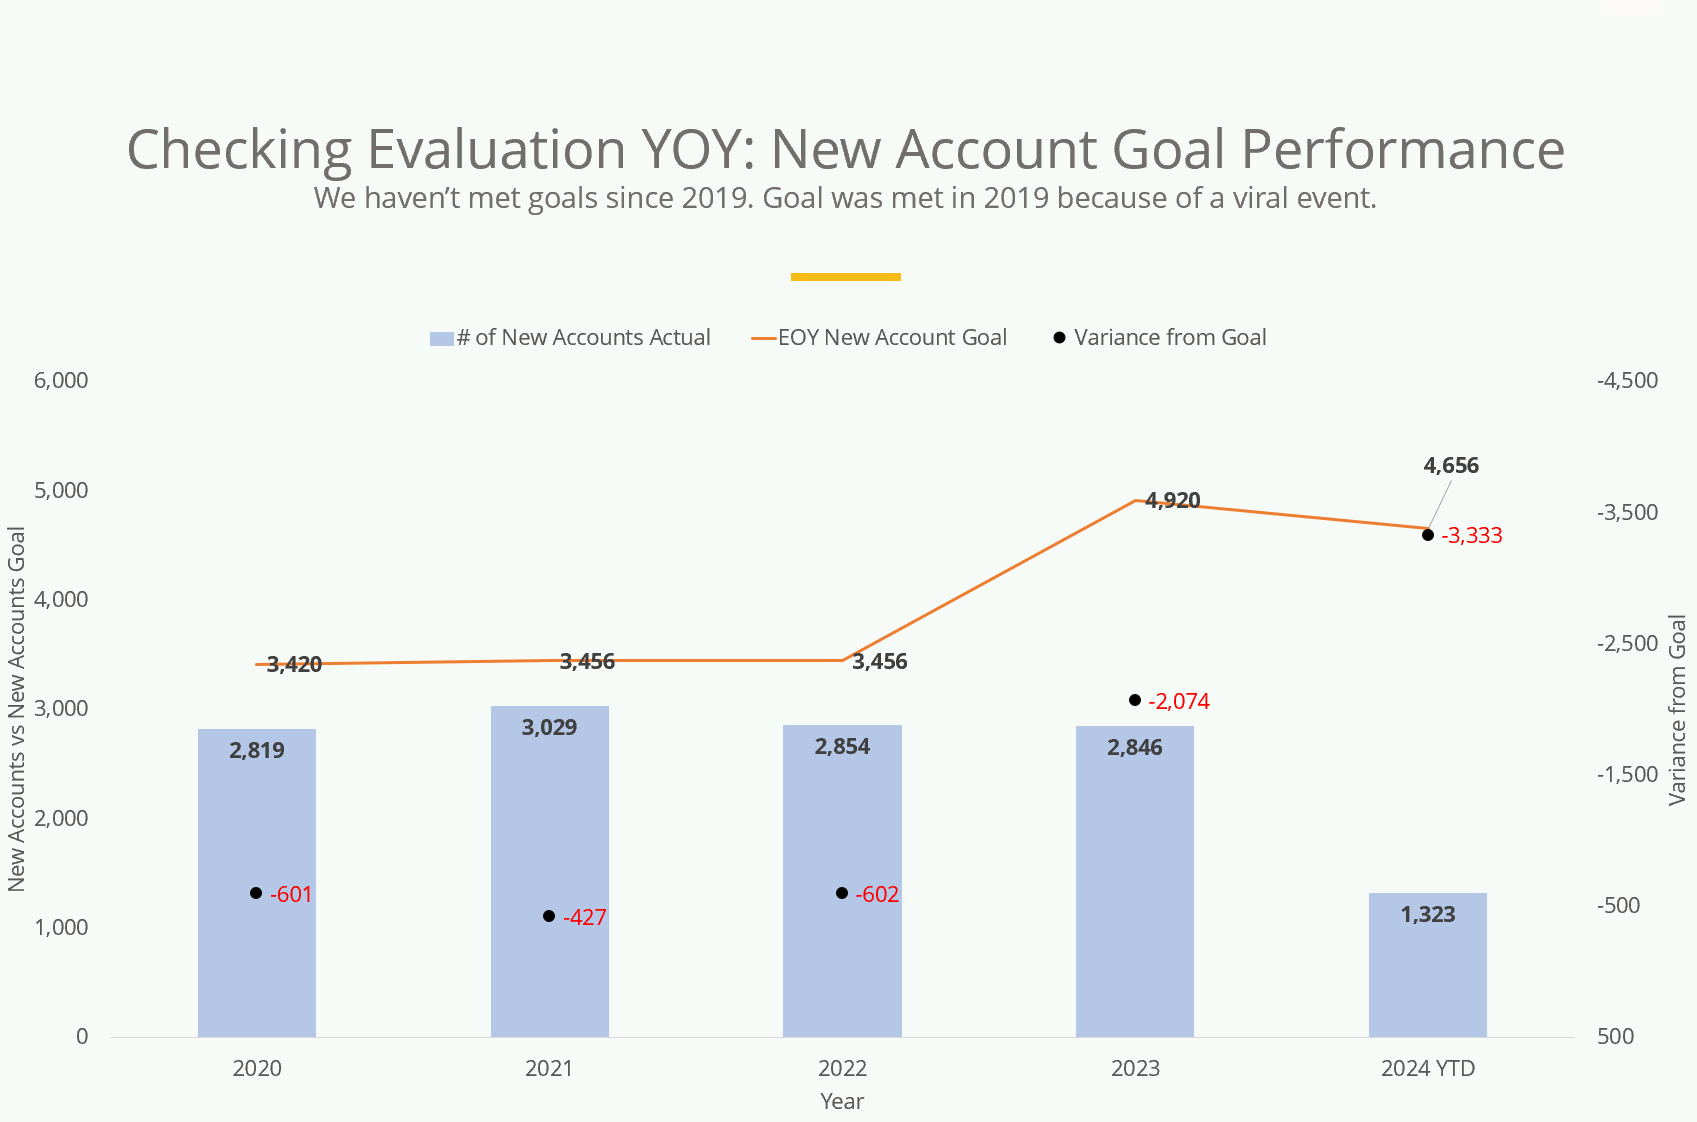
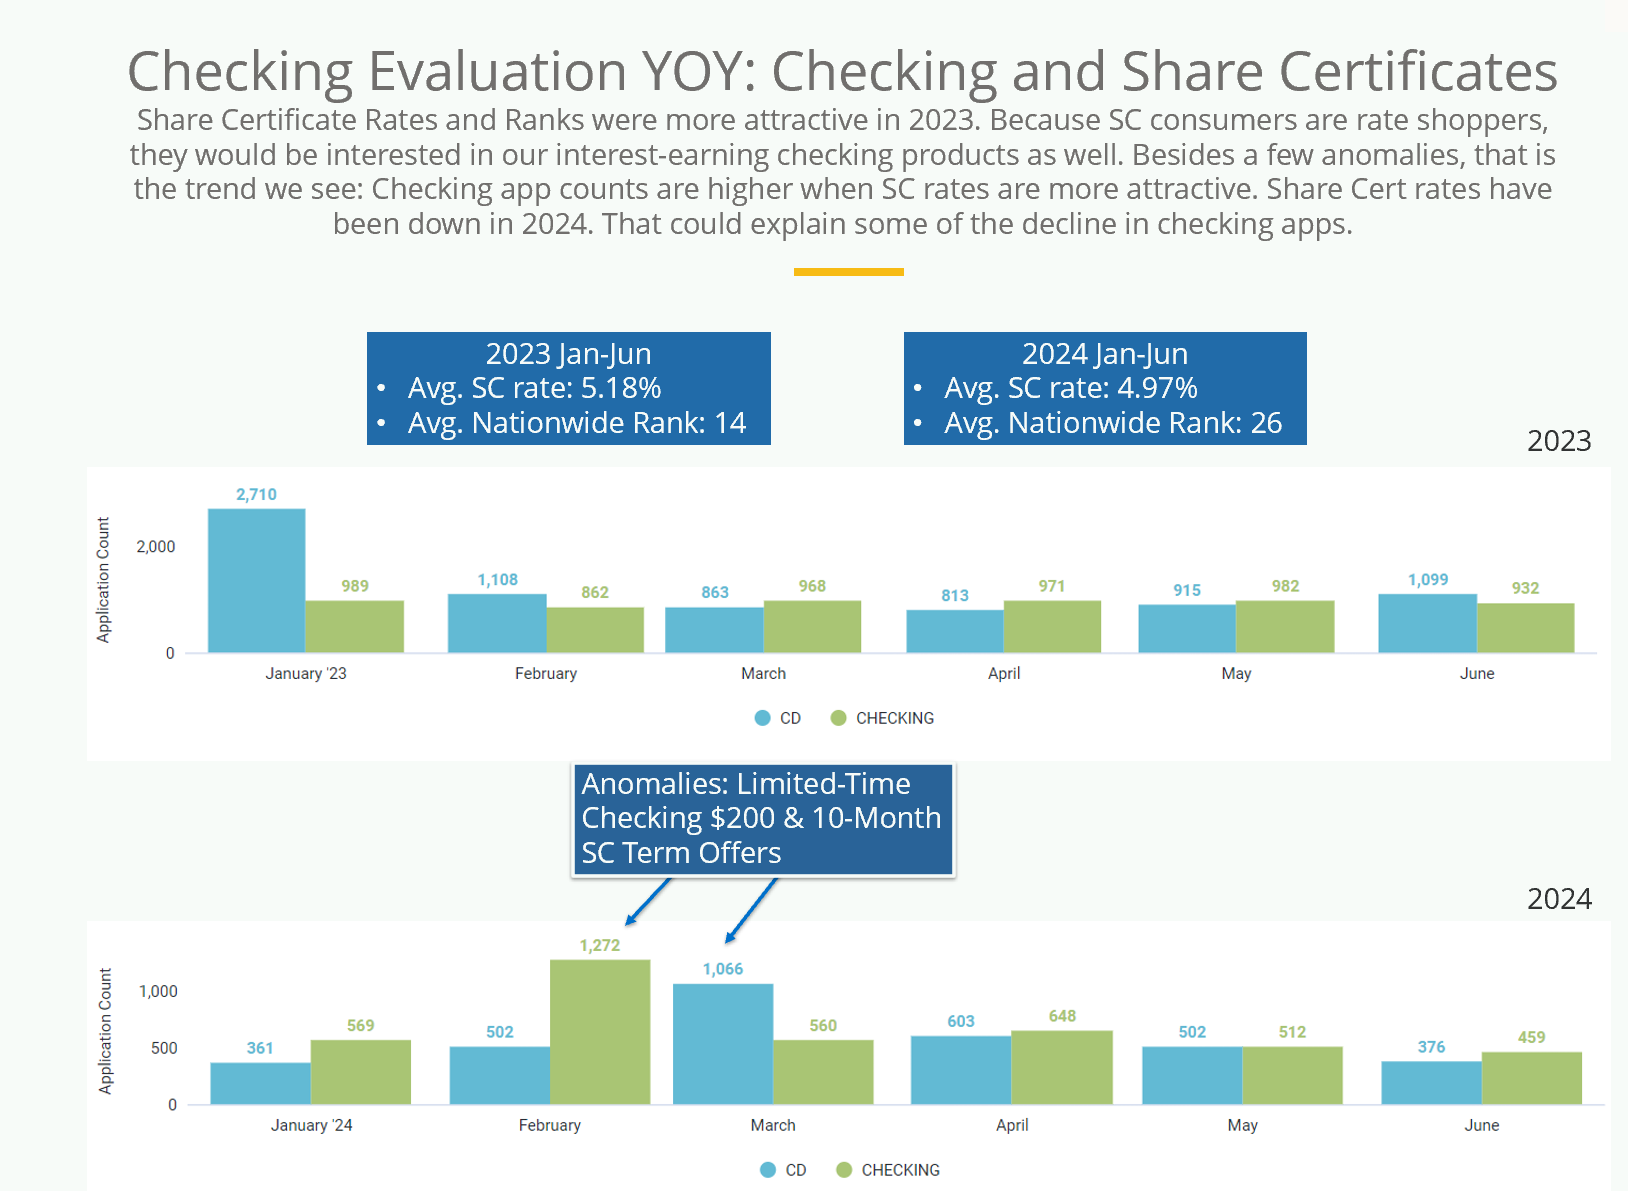
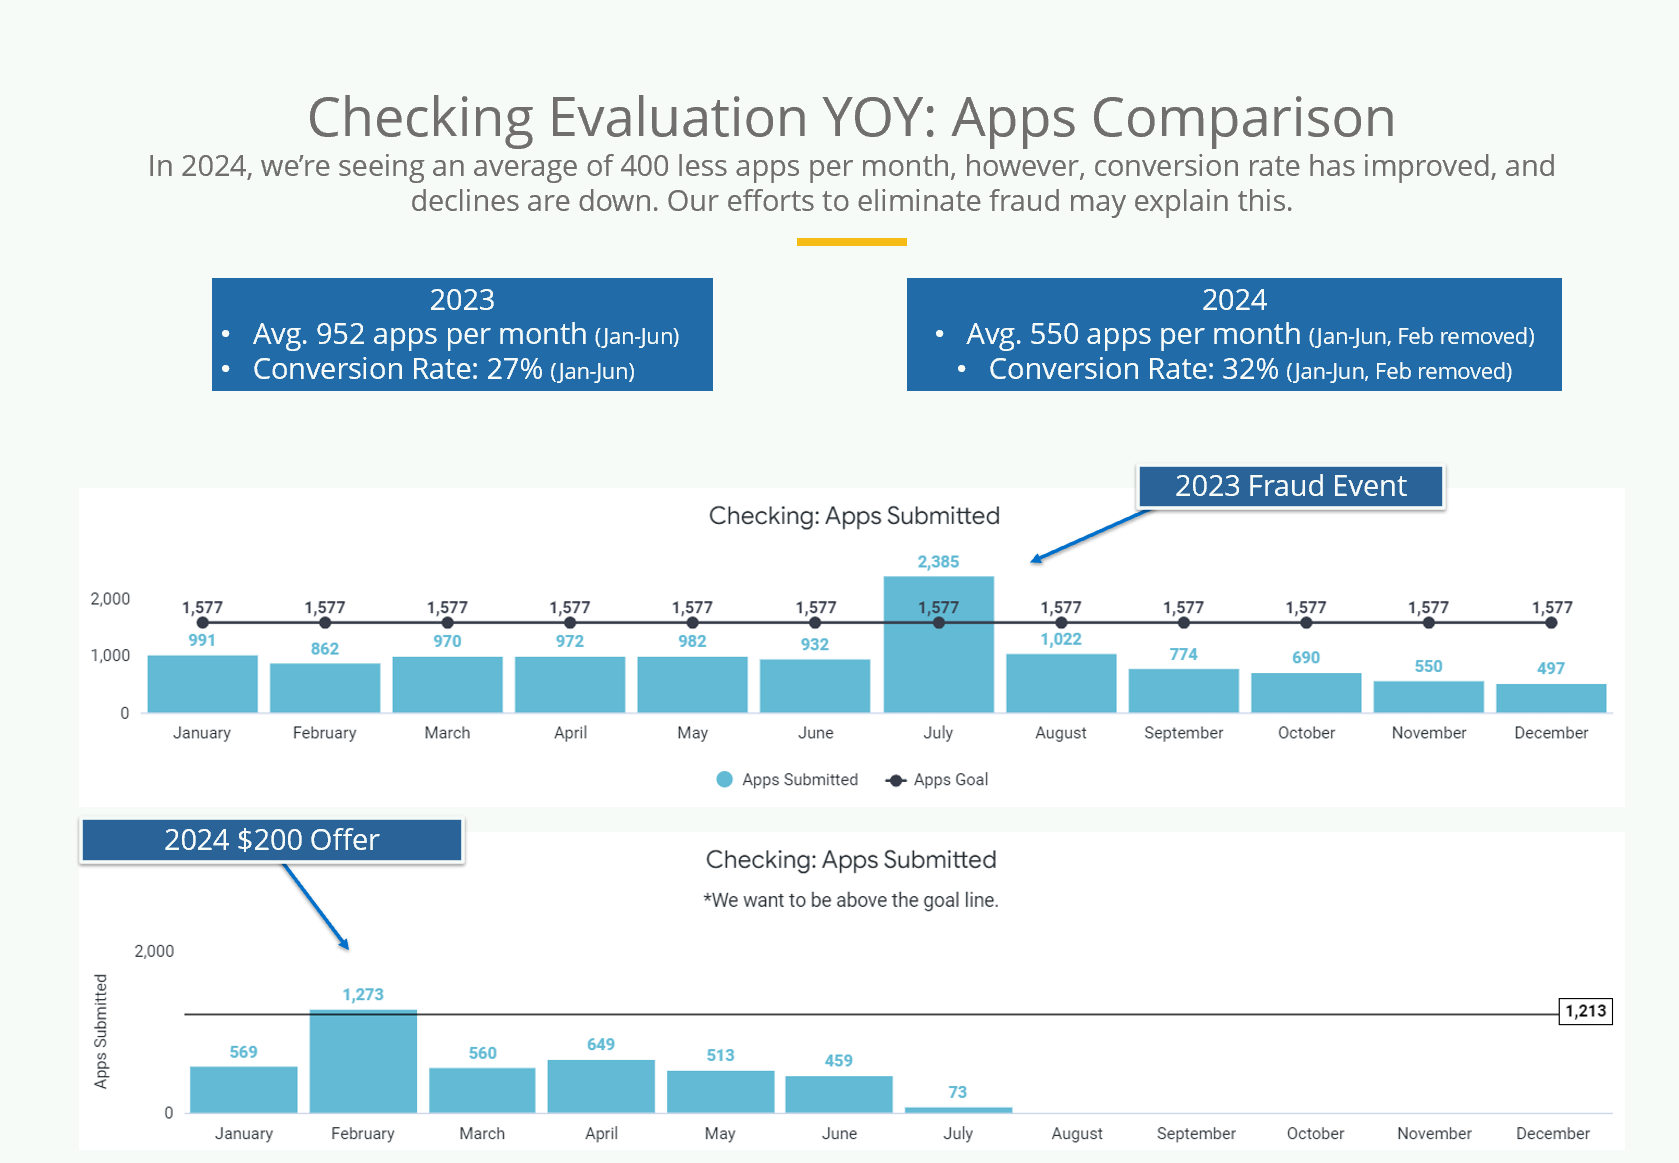
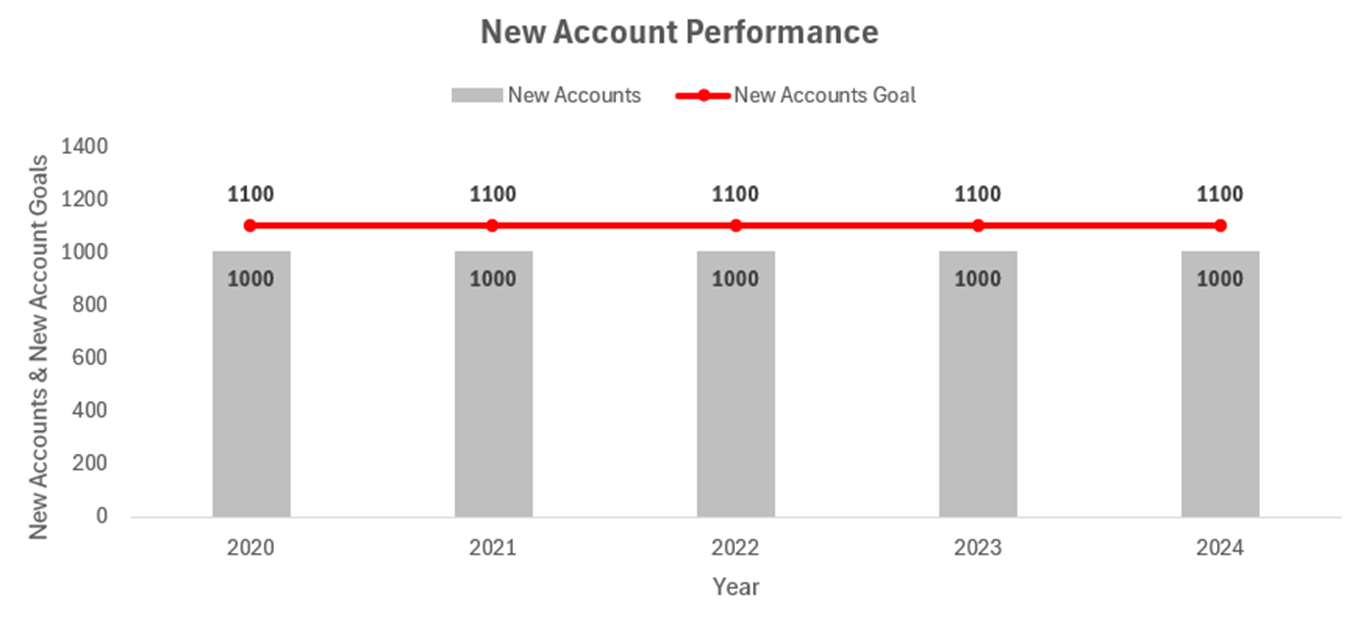
This dashboard gives stakeholders multiple views of product performance in relation to product goals.
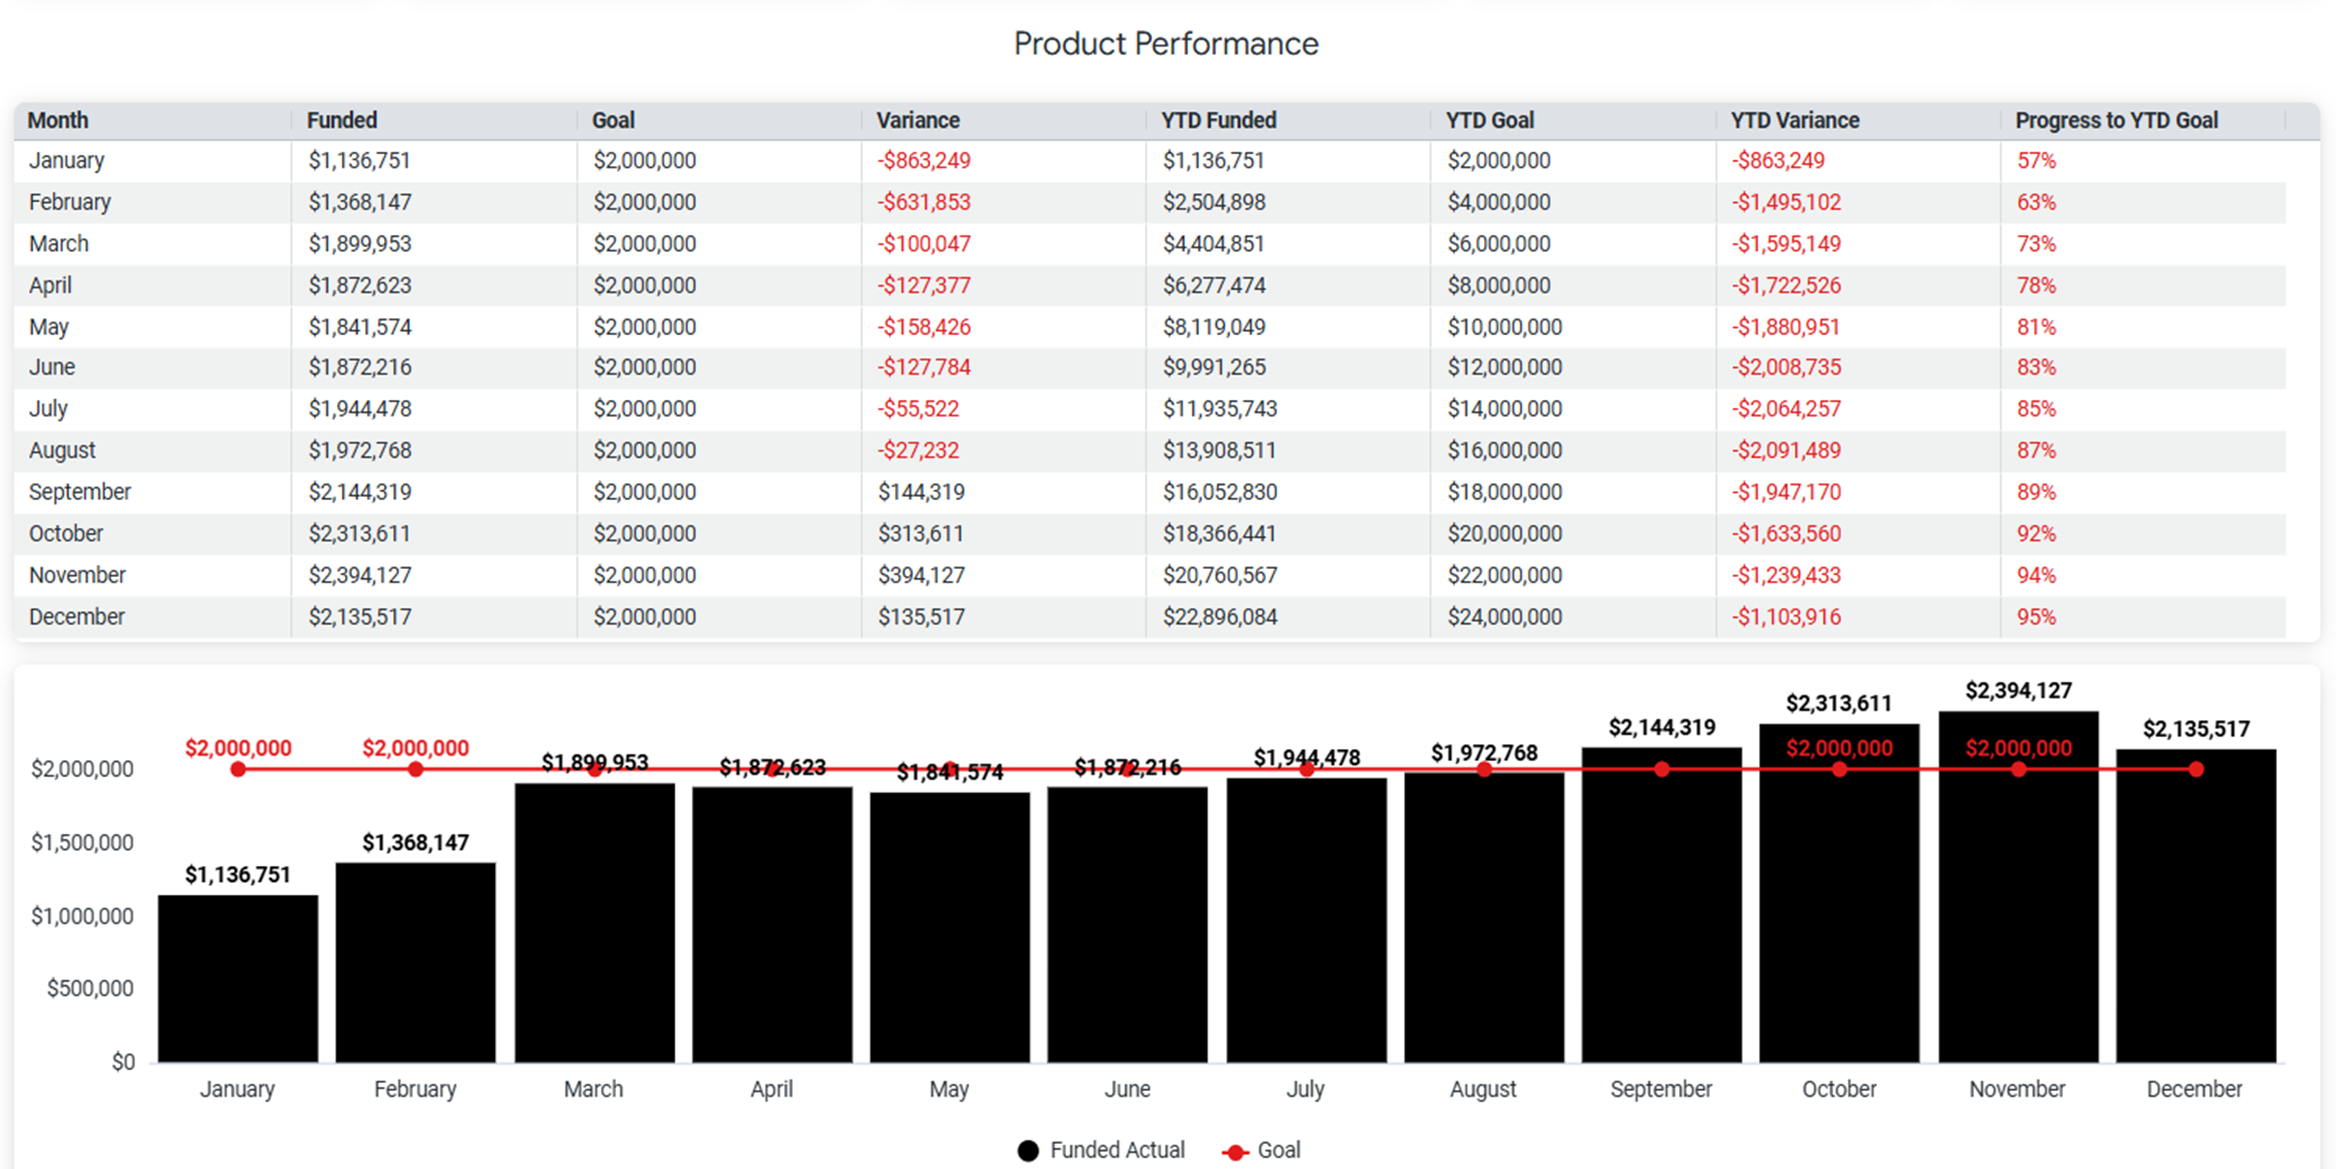
Please note: None of the data in this portfolio is real. It has been fabricated for the purpose of visualization.
This dashboard mimics the visualization above, giving stakeholders multiple views of product performance in relation to product goals, but it was created in Power BI.
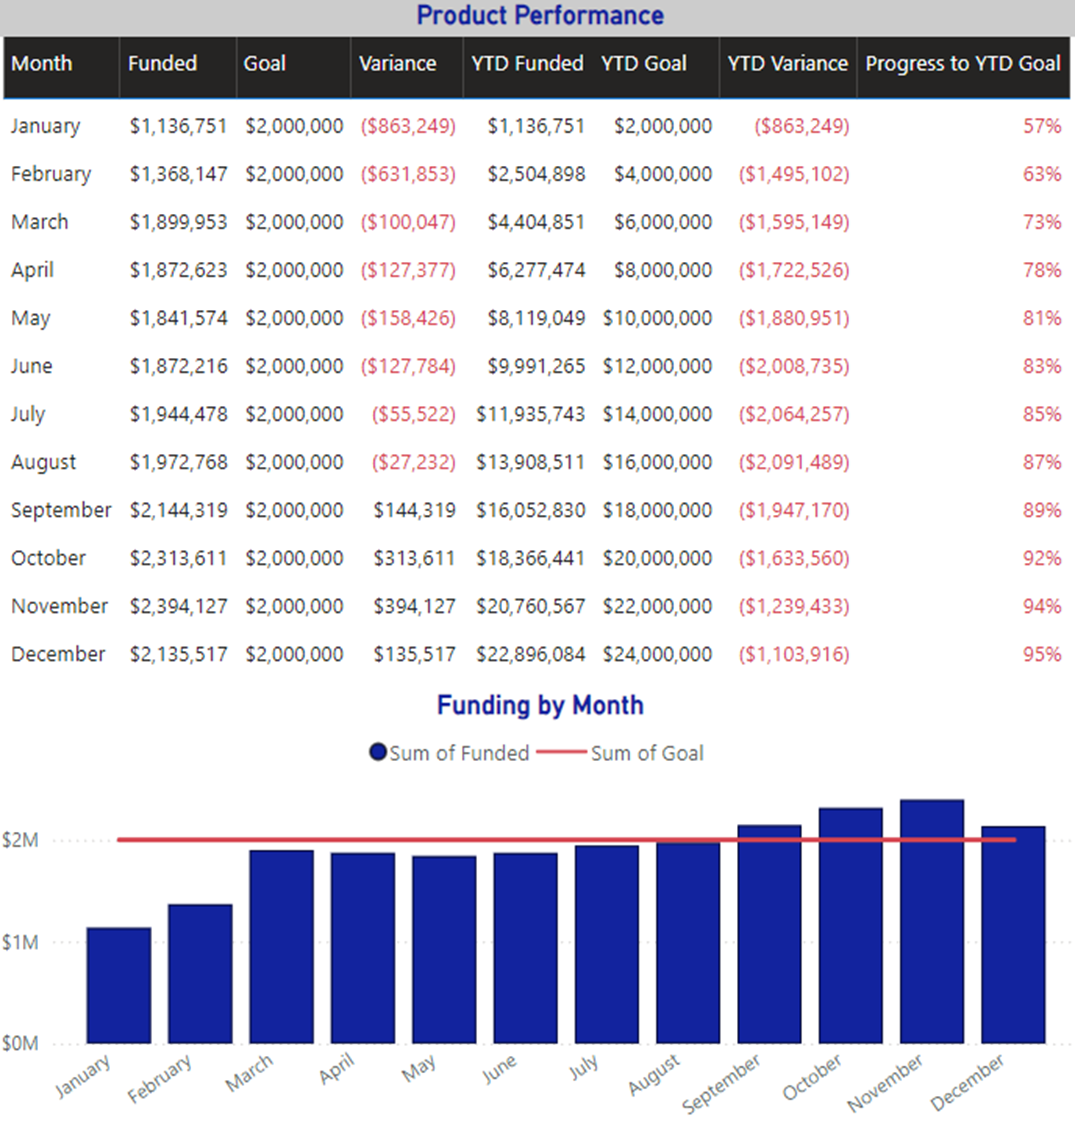
Please note: None of the data in this portfolio is real. It has been fabricated for the purpose of visualization.
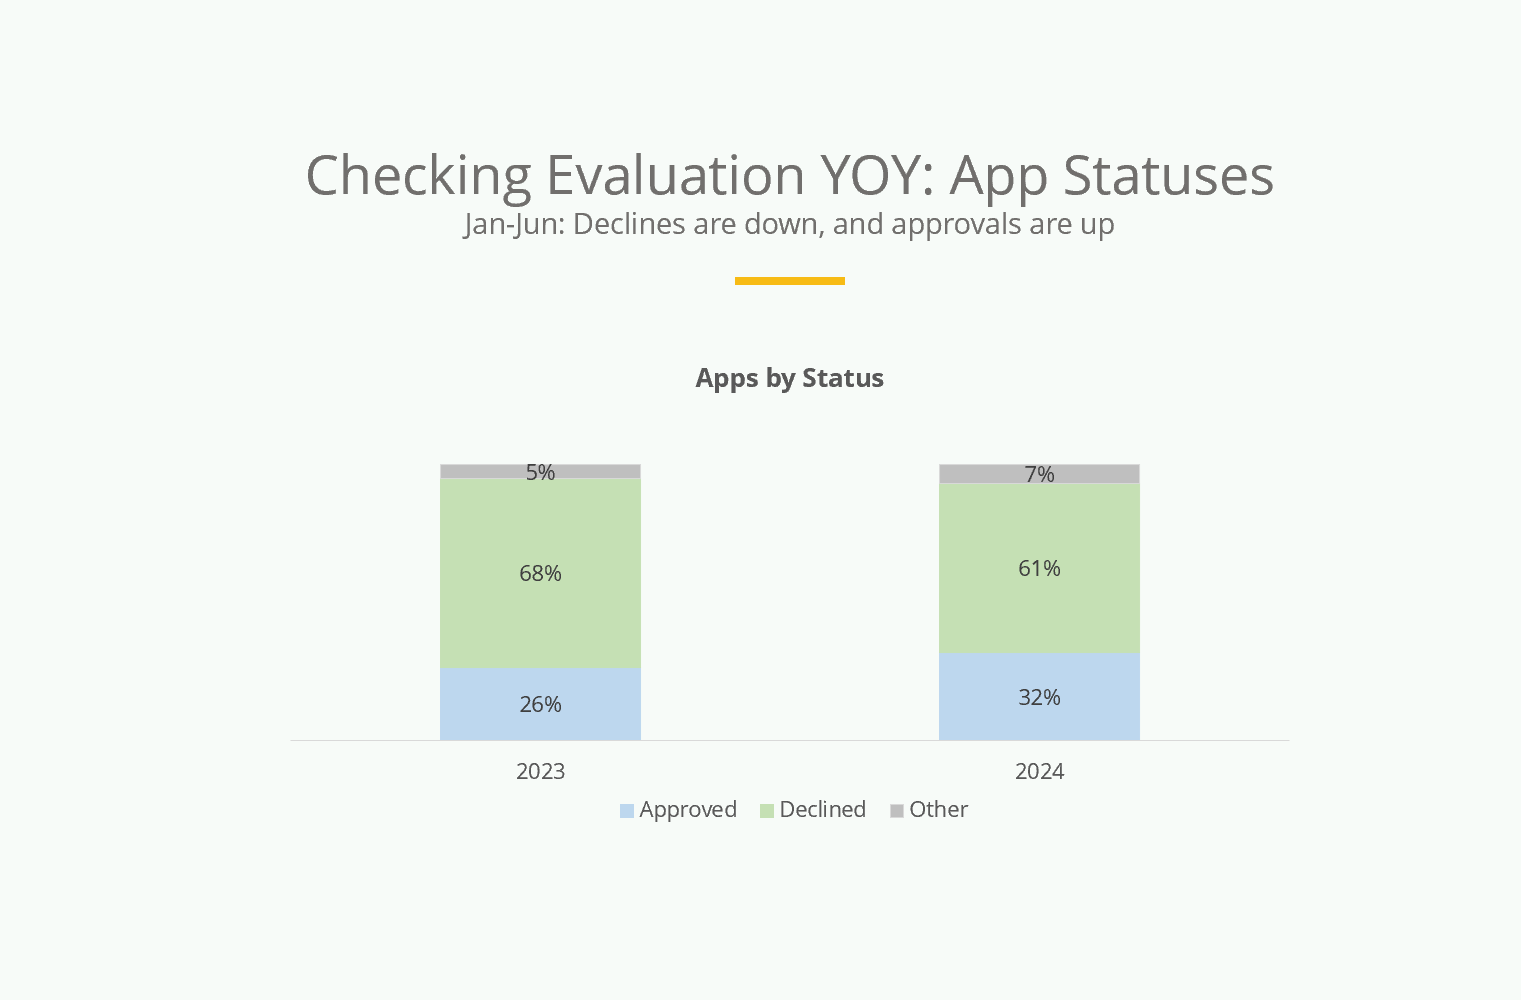
Please note: None of the data in this portfolio is real. It has been fabricated for visualization purposes.

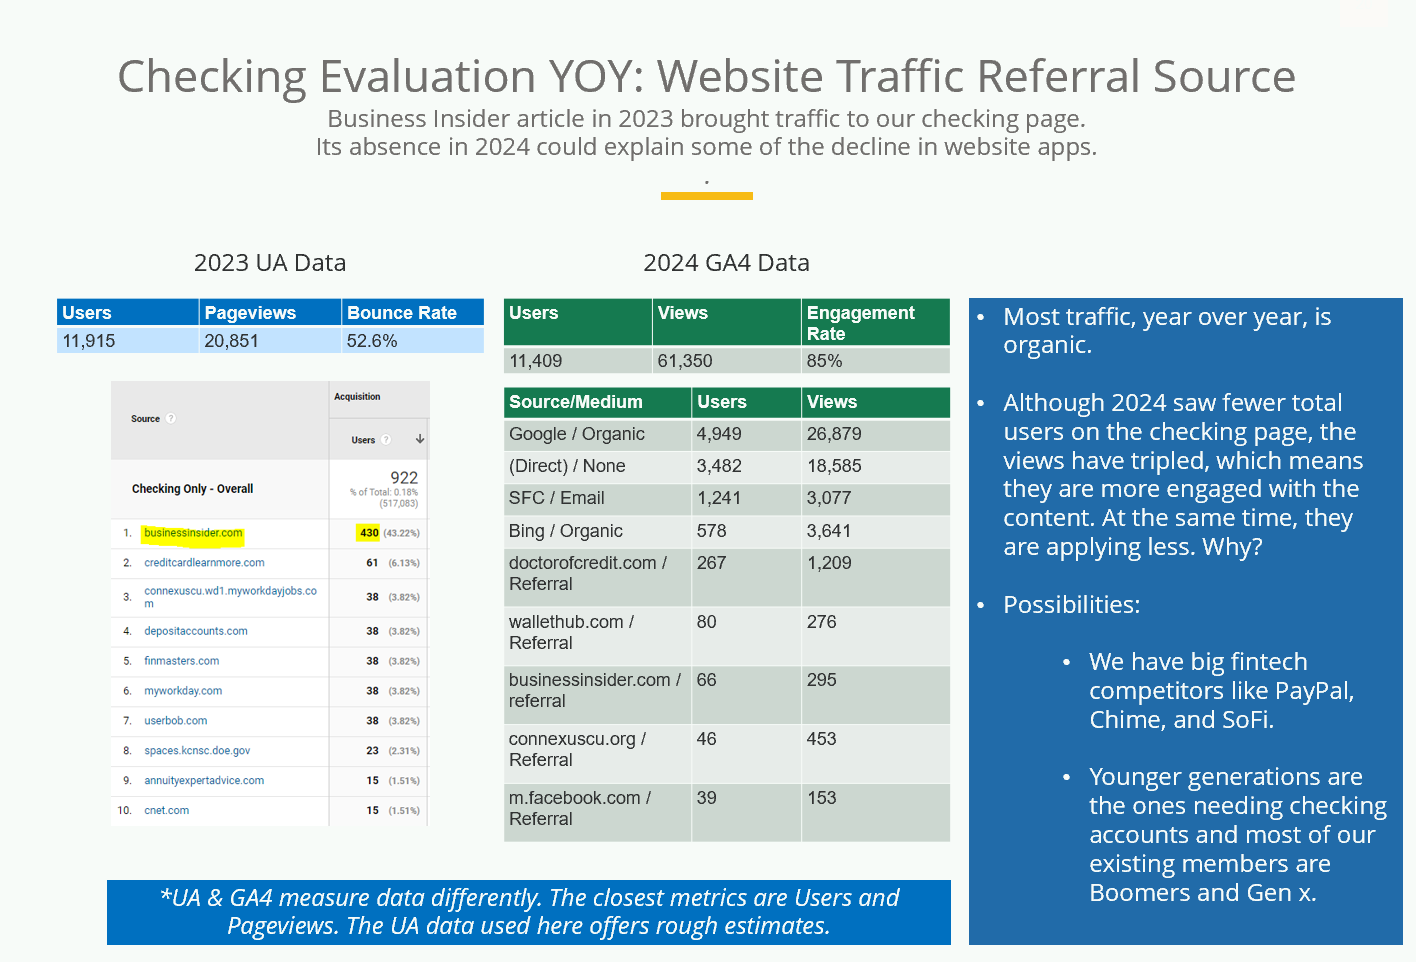
Please note: None of the data in this portfolio is real. It has been fabricated for visualization purposes.
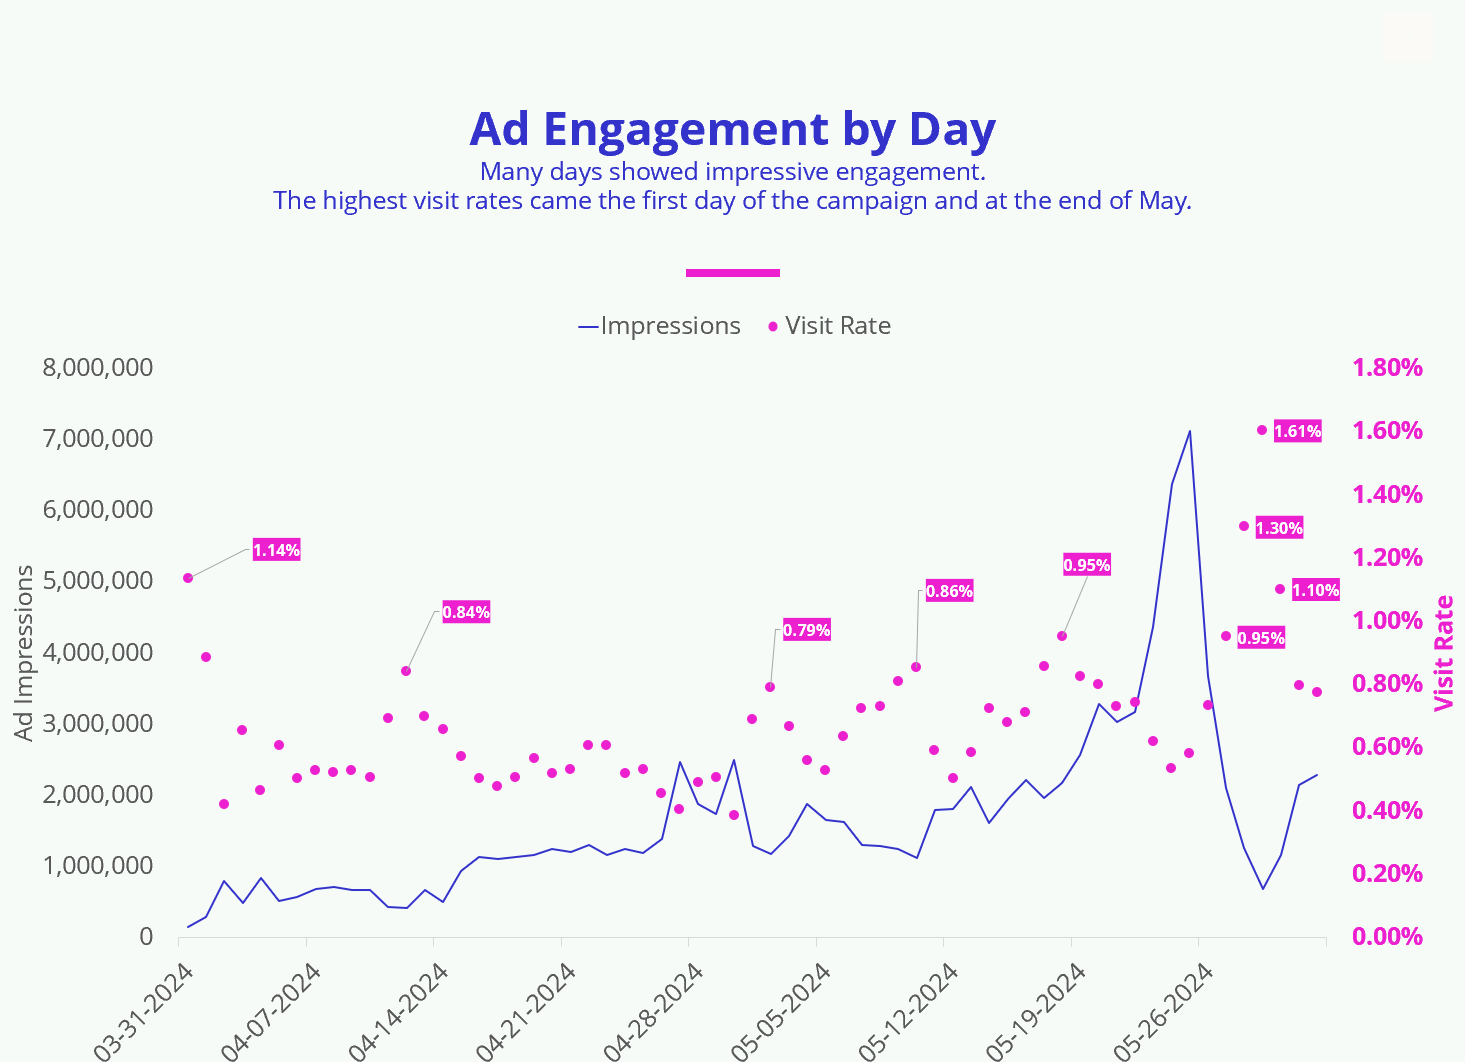
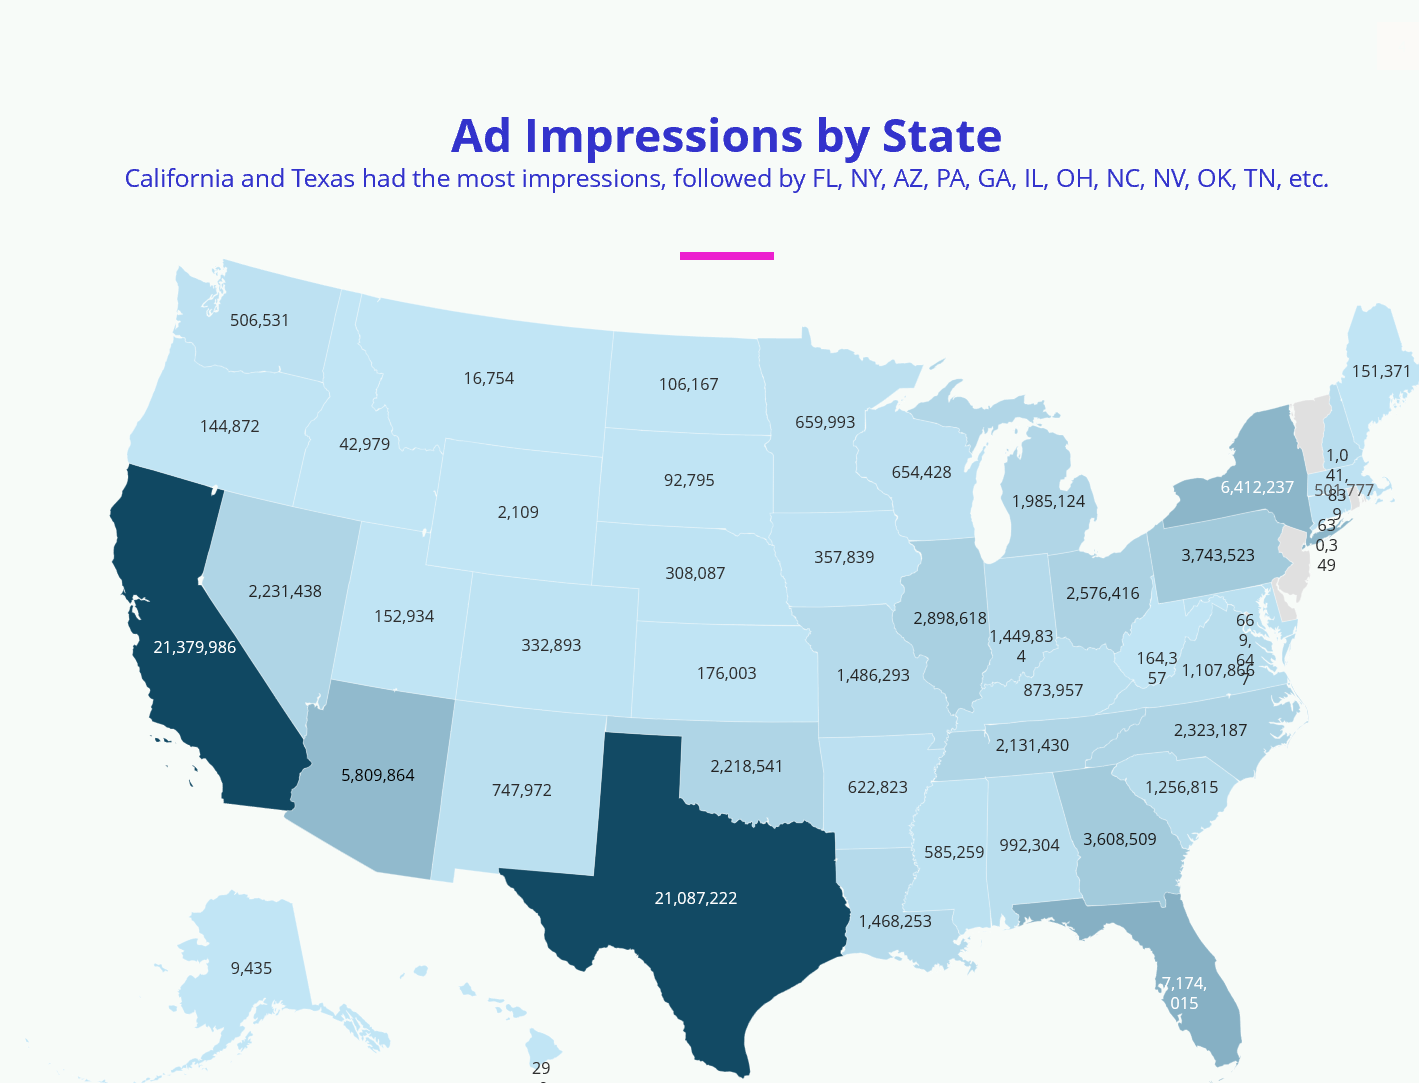
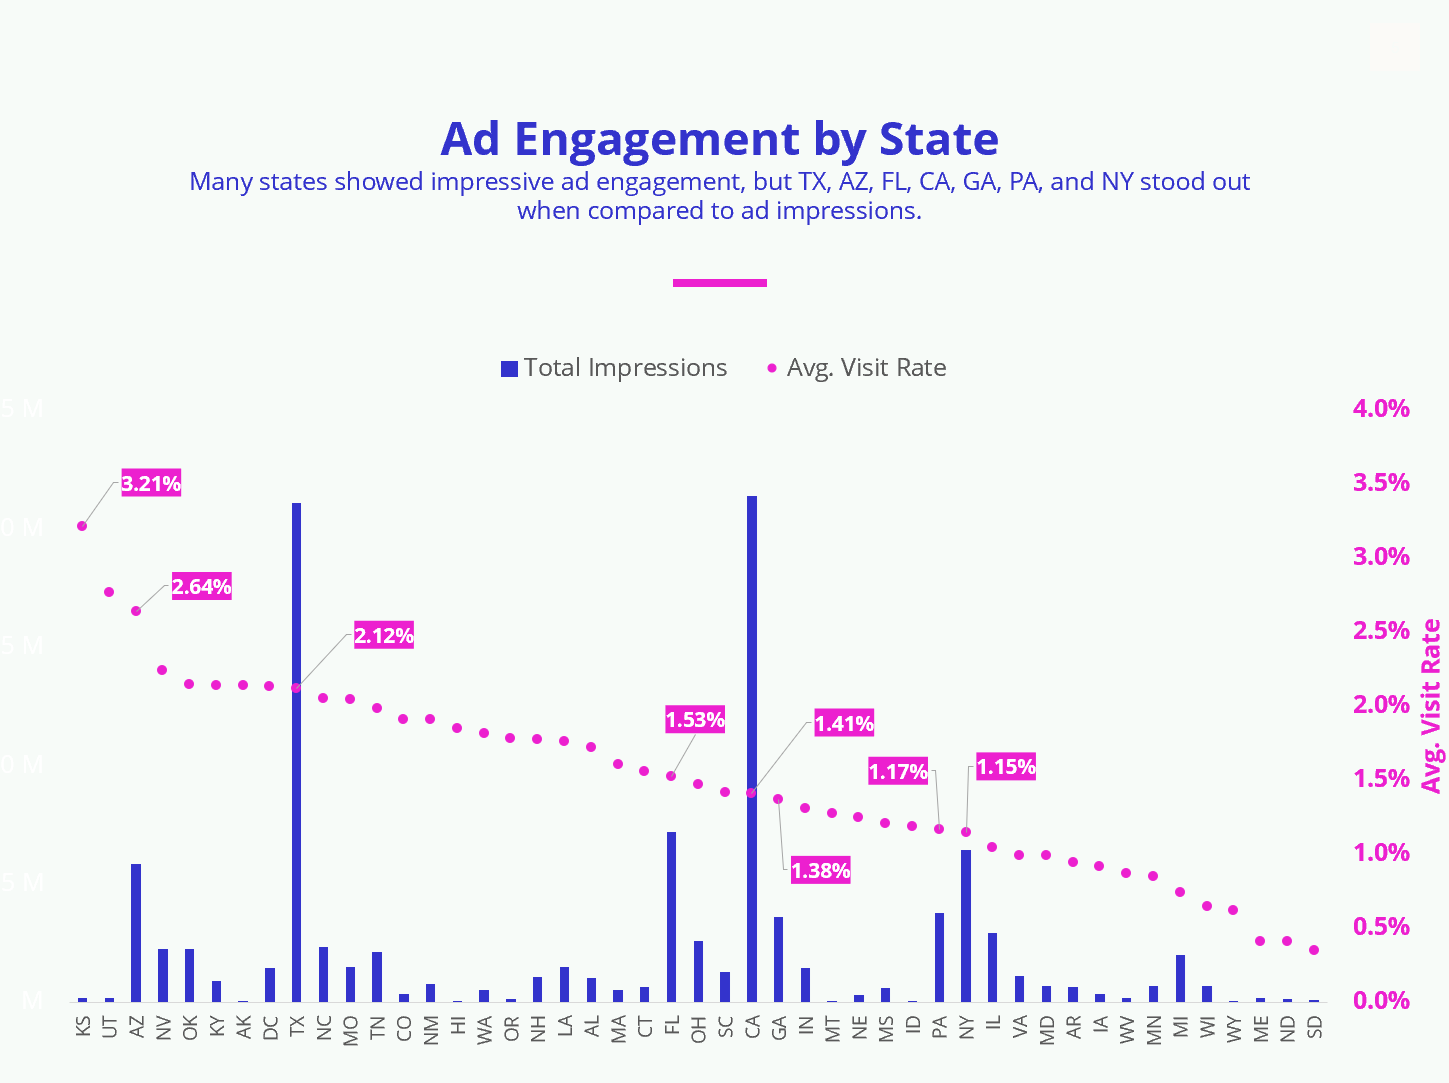
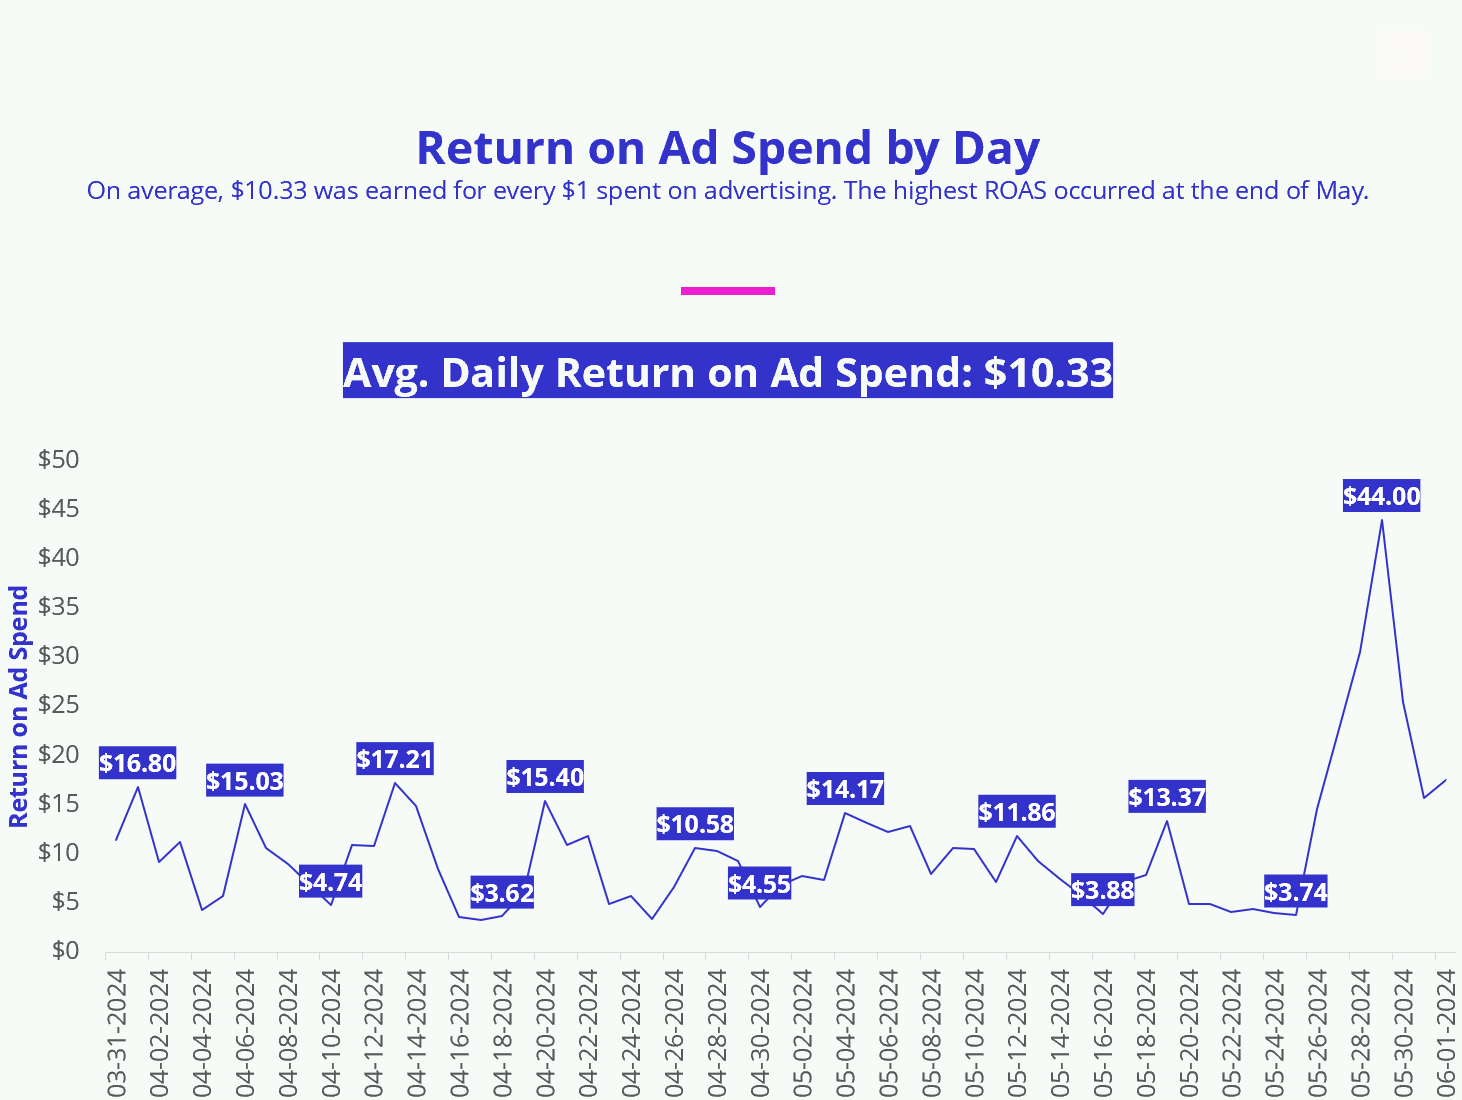
A report template like this, which can be altered visually to adhere to brand design, can be used to send daily, weekly, or monthly reports with consistency.
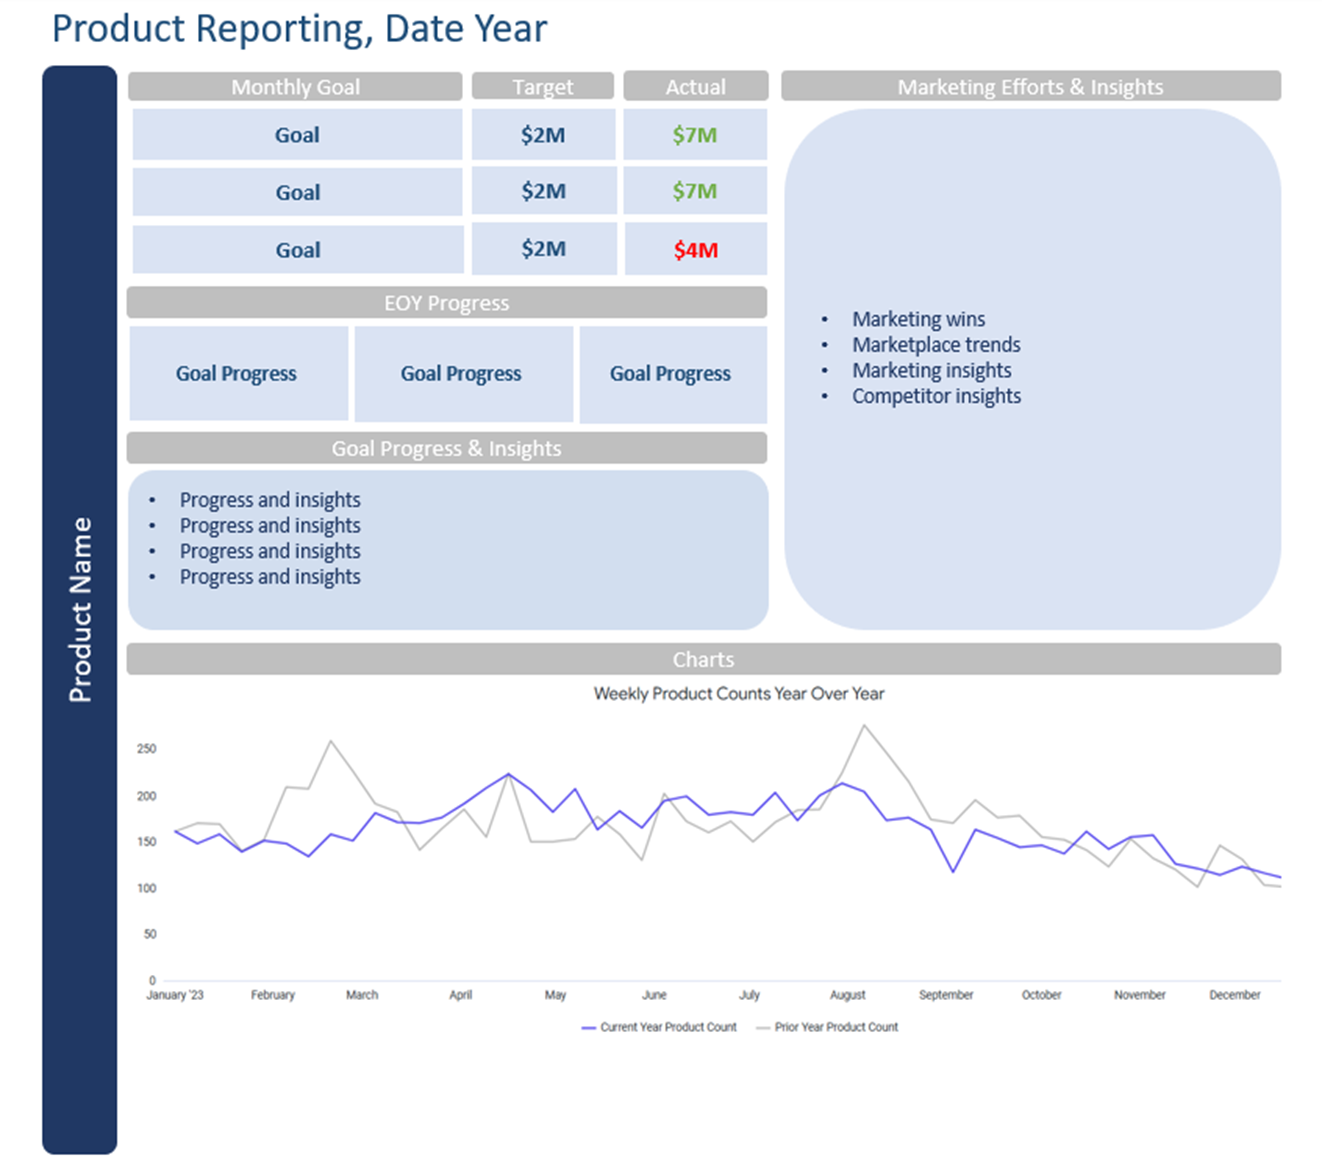
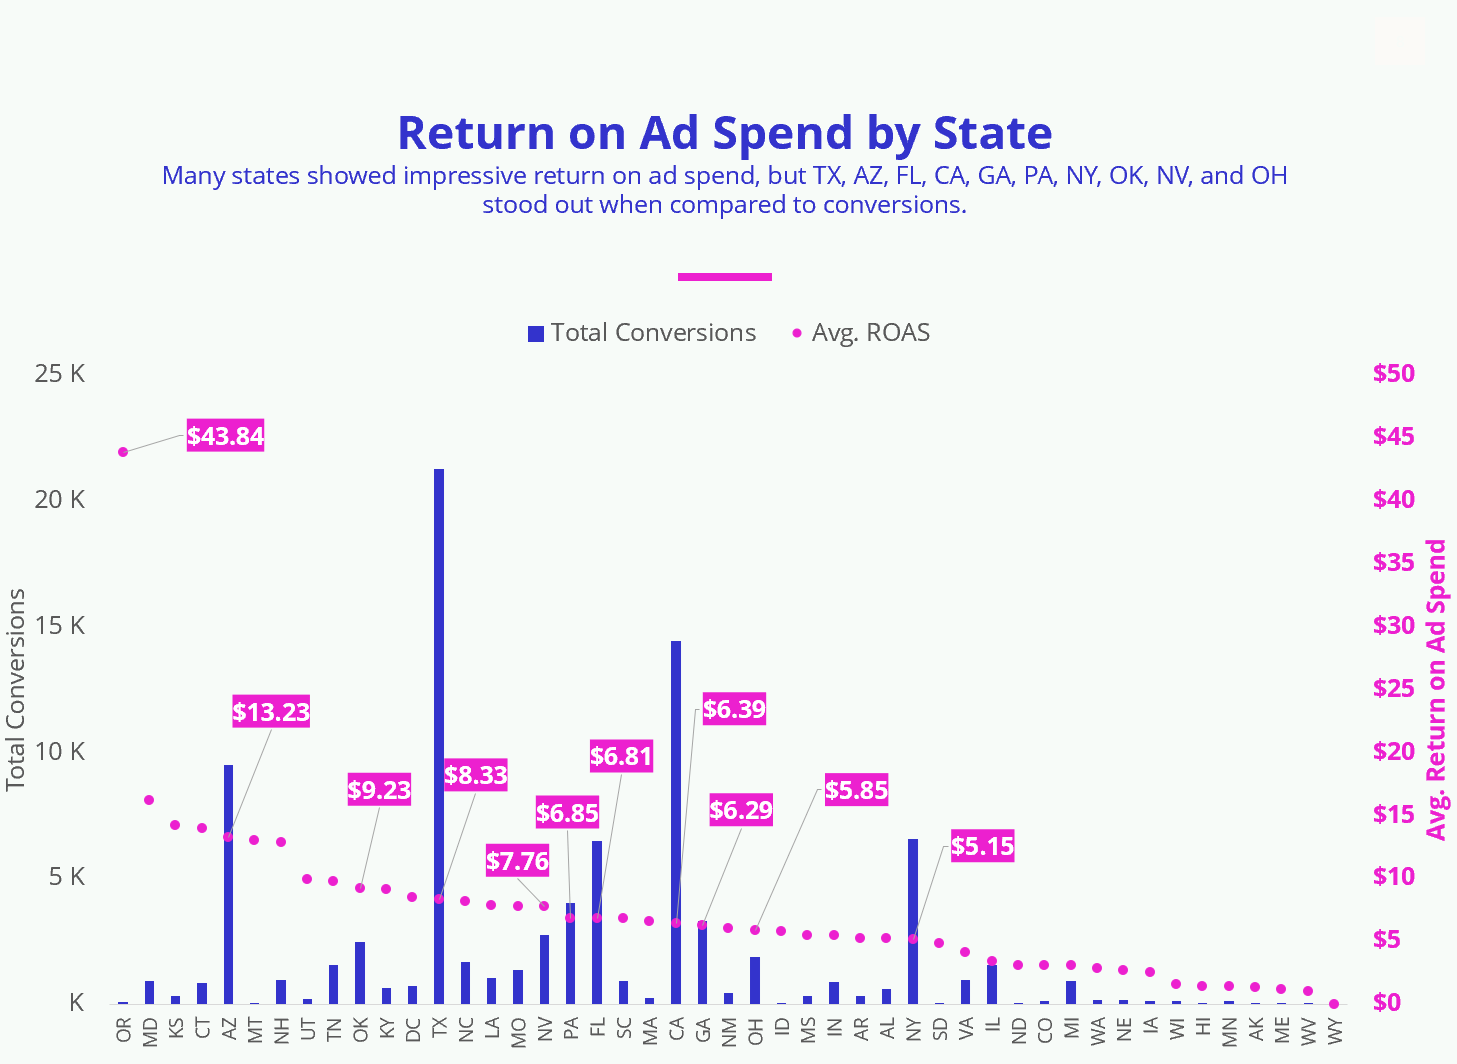
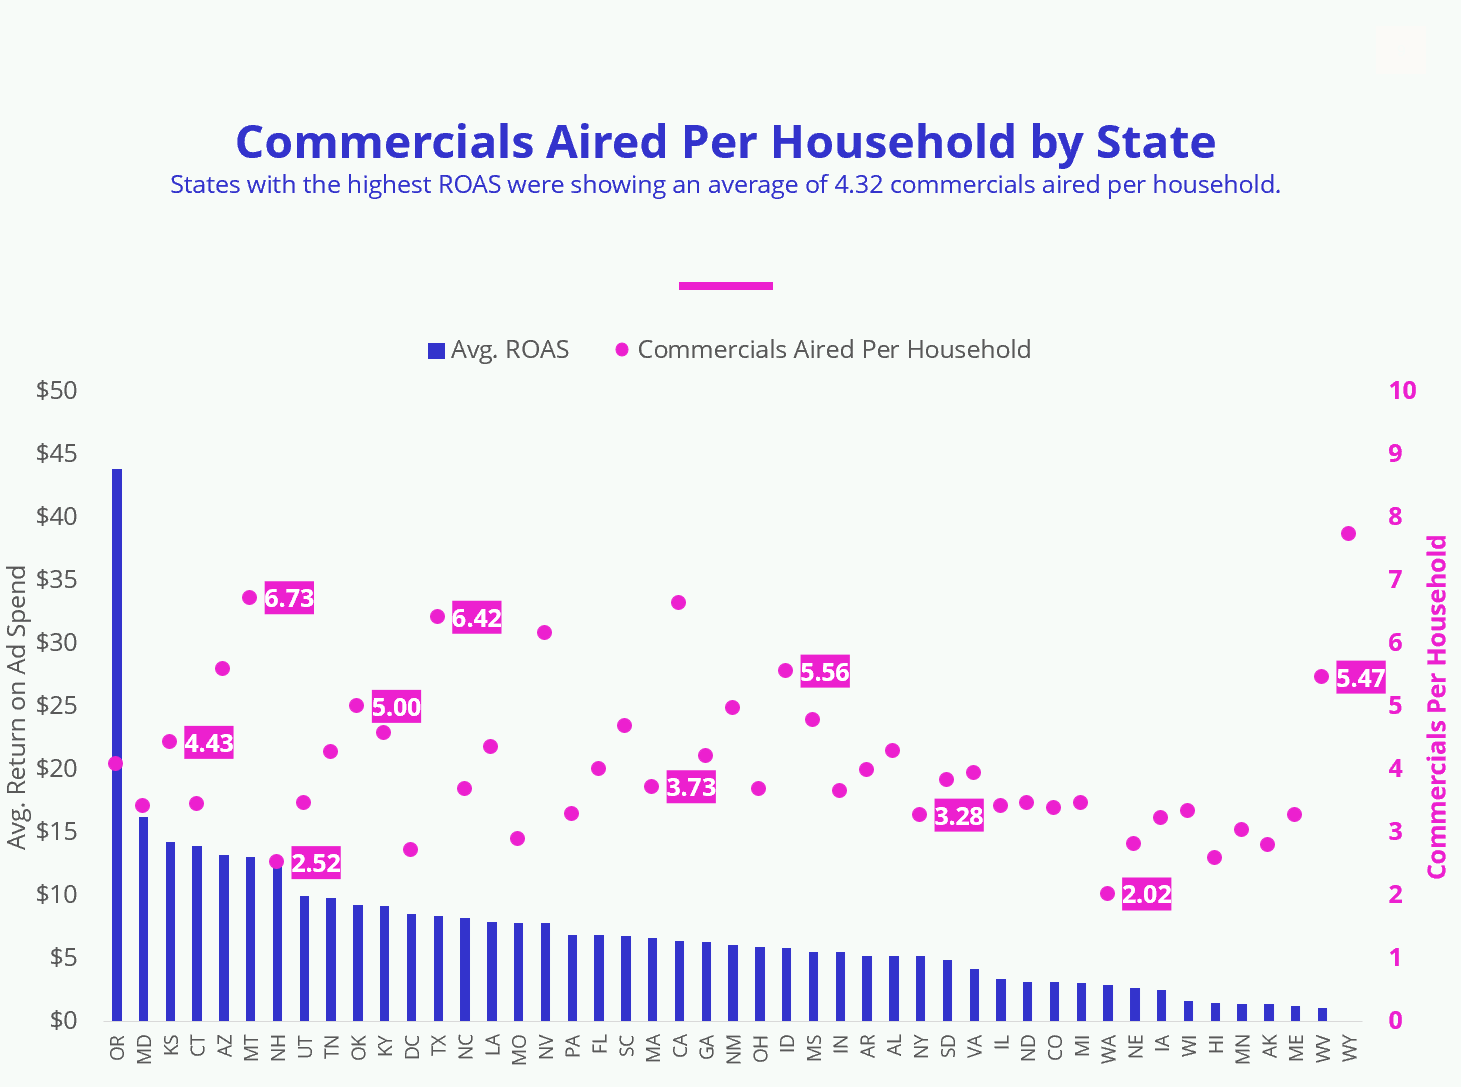
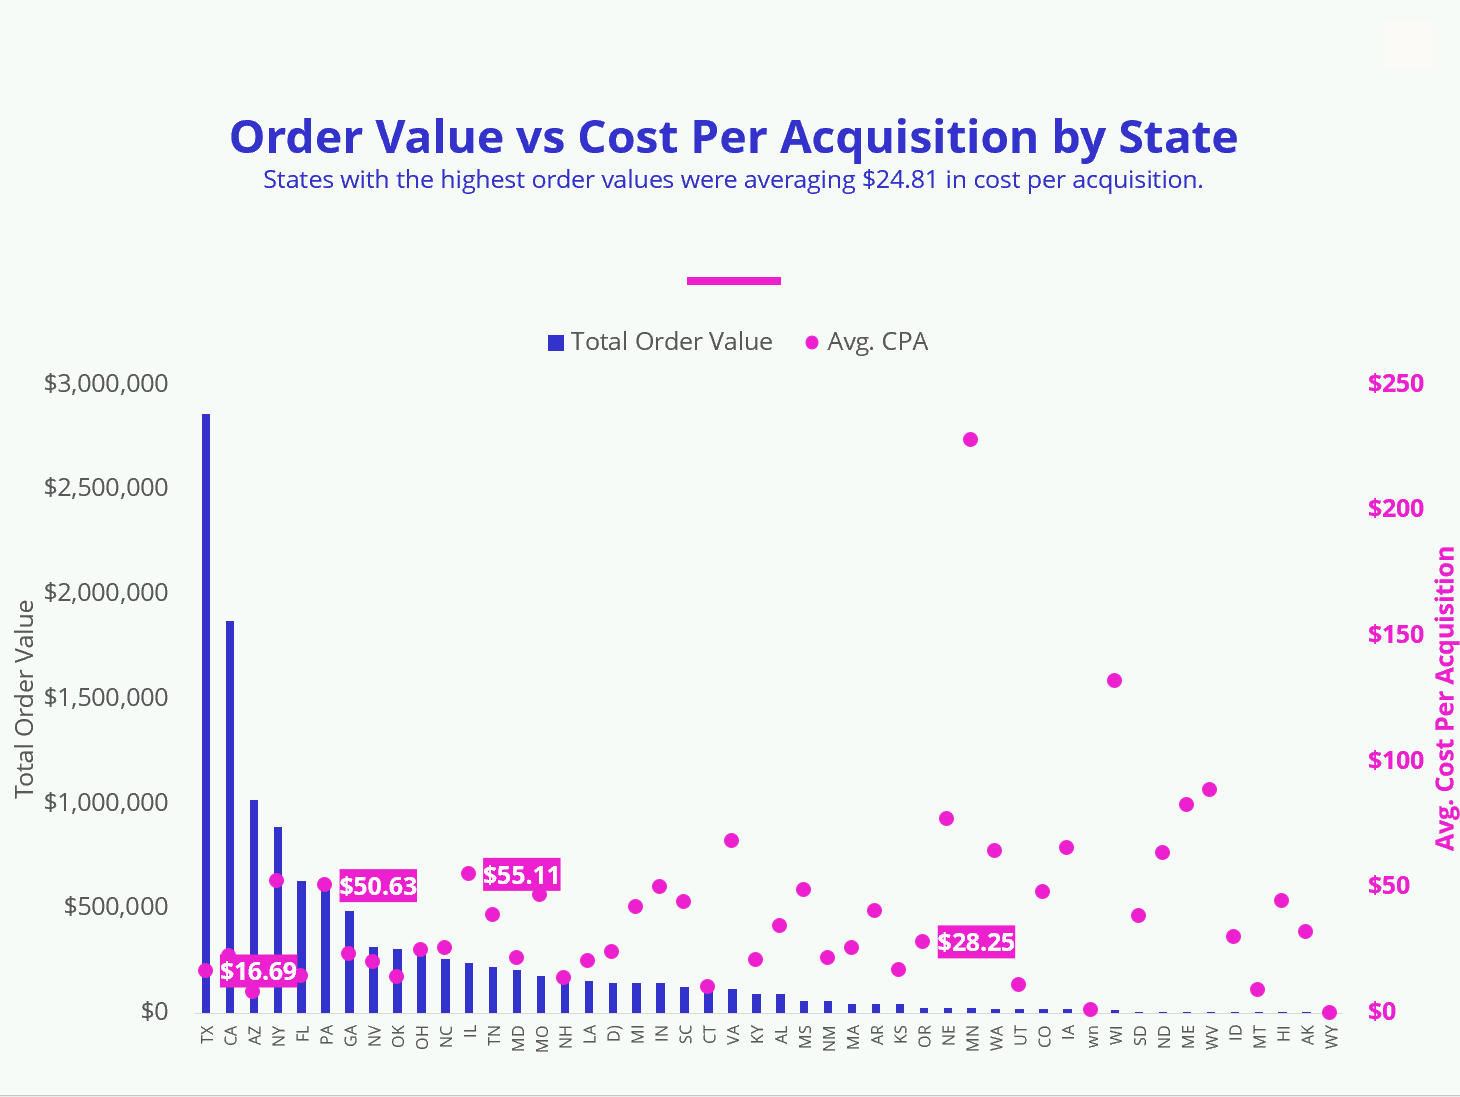
Please note: None of the data in this portfolio is real. It has been fabricated for visualization purposes.
